 37
37peptides
spectra
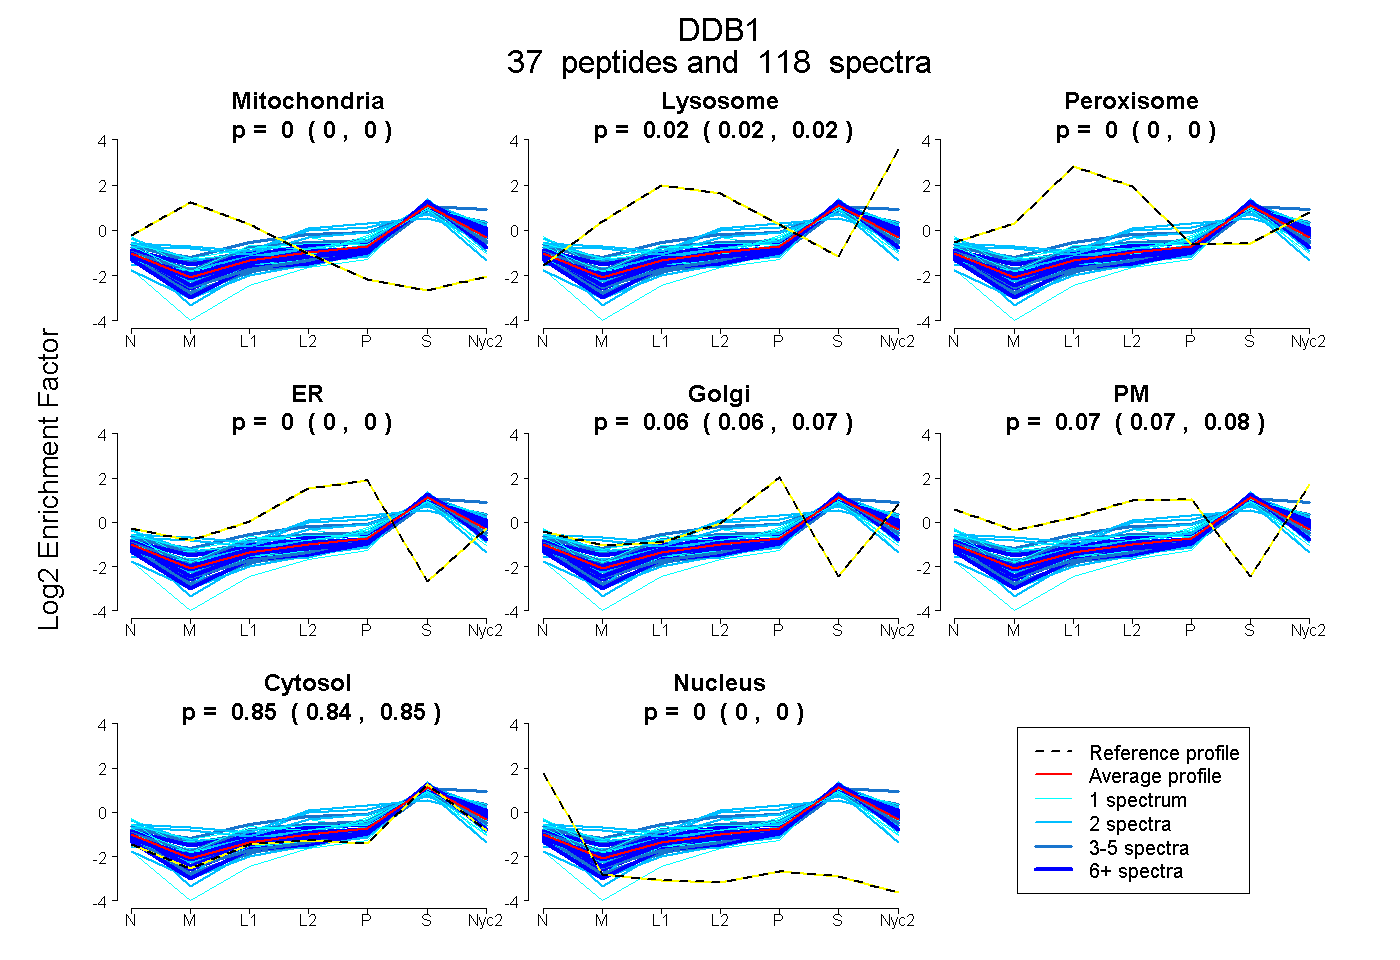
0.000 | 0.000
0.018 | 0.024
0.000 | 0.000
0.000 | 0.000
0.055 | 0.065
0.066 | 0.078
0.843 | 0.847
0.000 | 0.000
17peptides
spectra
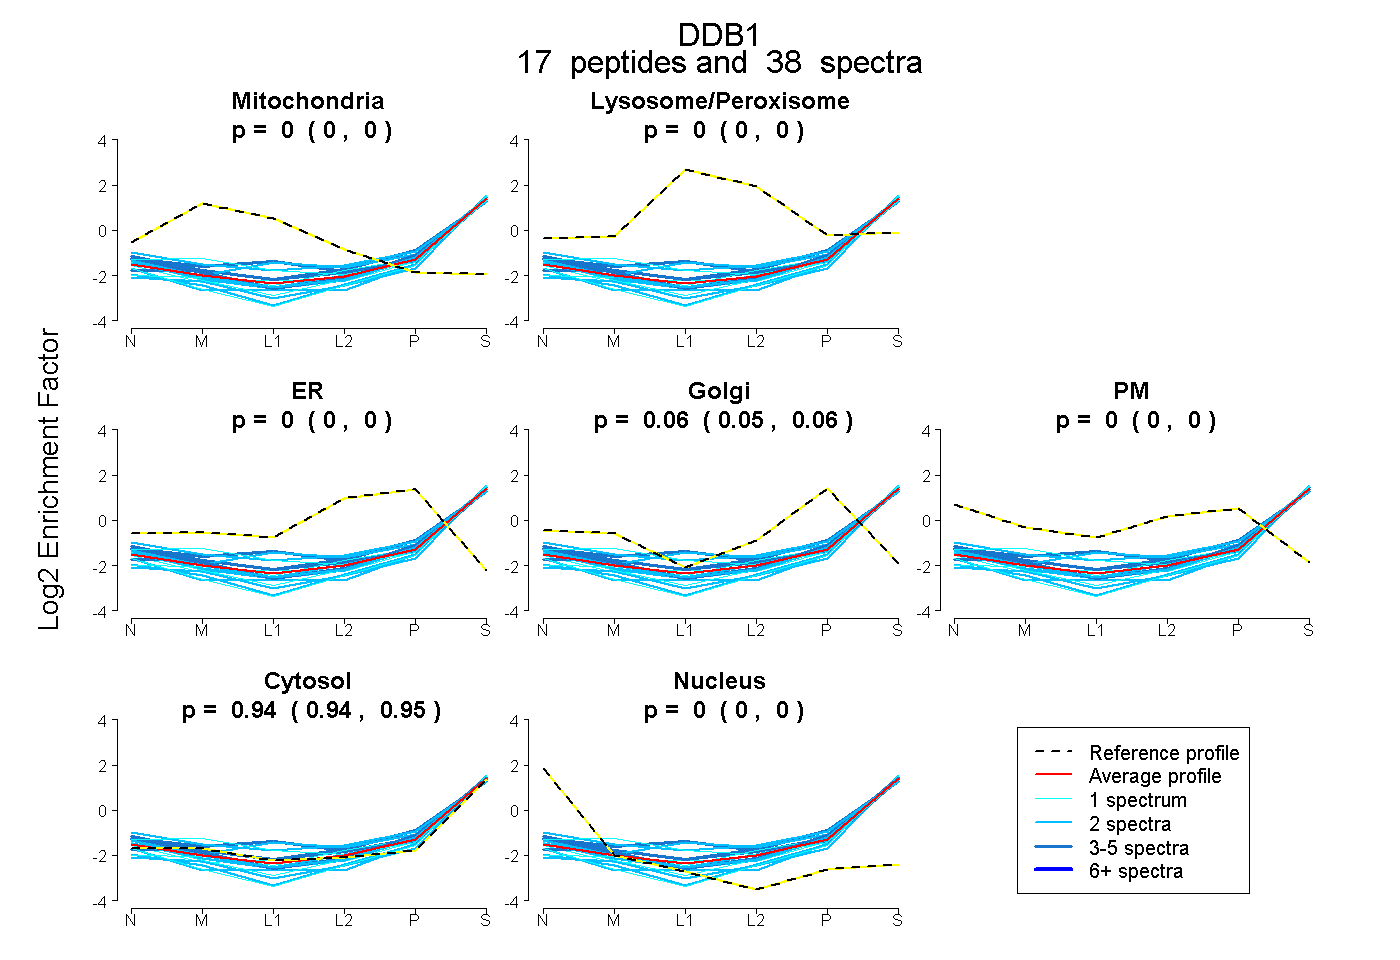
0.000 | 0.000
0.000 | 0.000
0.000 | 0.000
0.052 | 0.058
0.000 | 0.000
0.942 | 0.947
0.000 | 0.000
31peptides
spectra
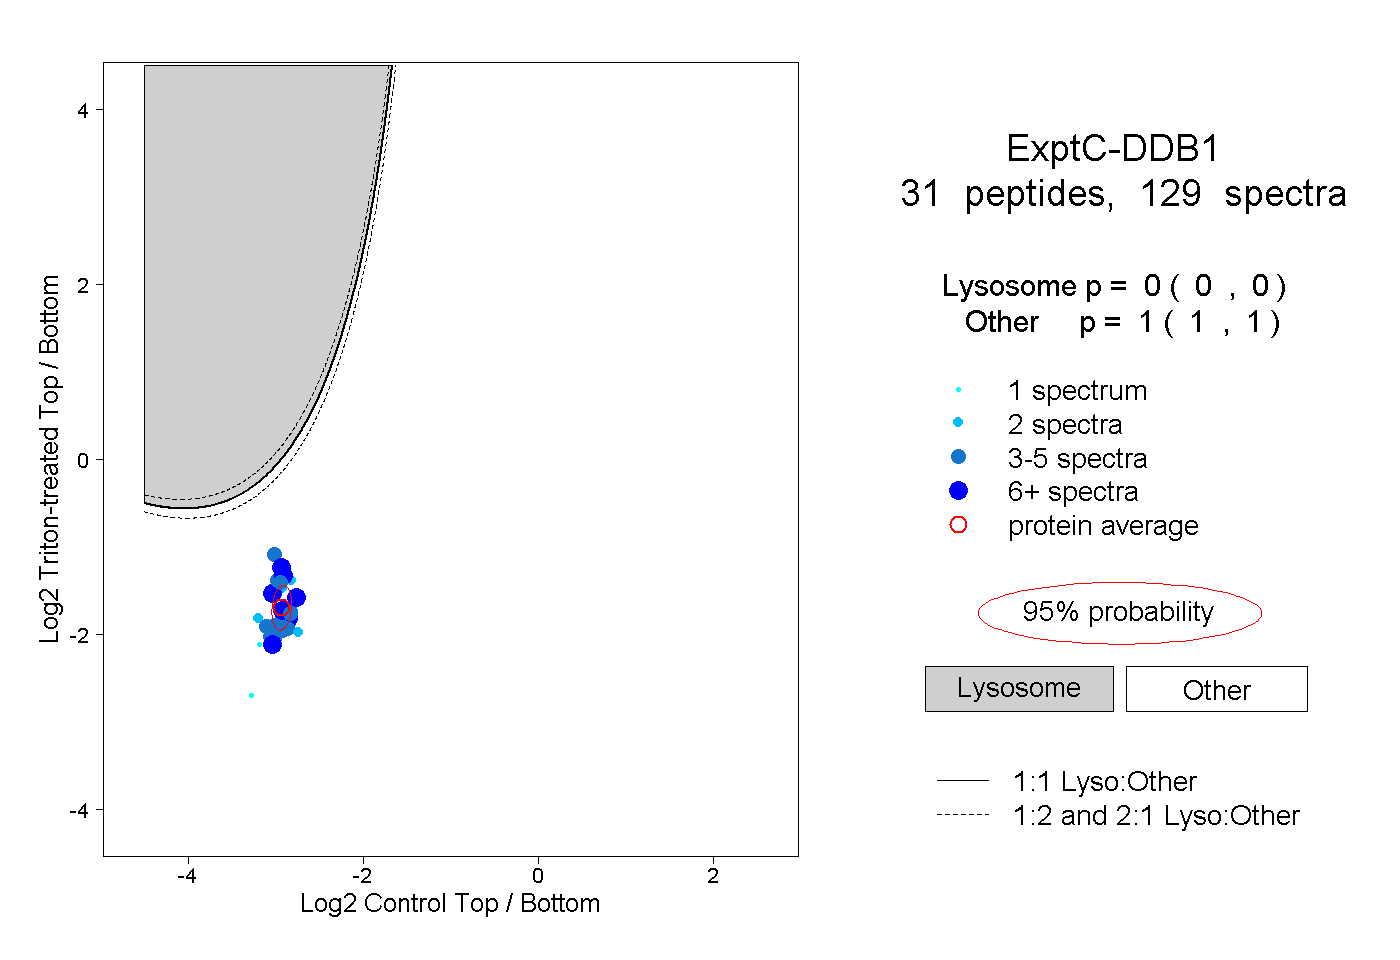
0.000 | 0.000
1.000 | 1.000
9peptides
spectra
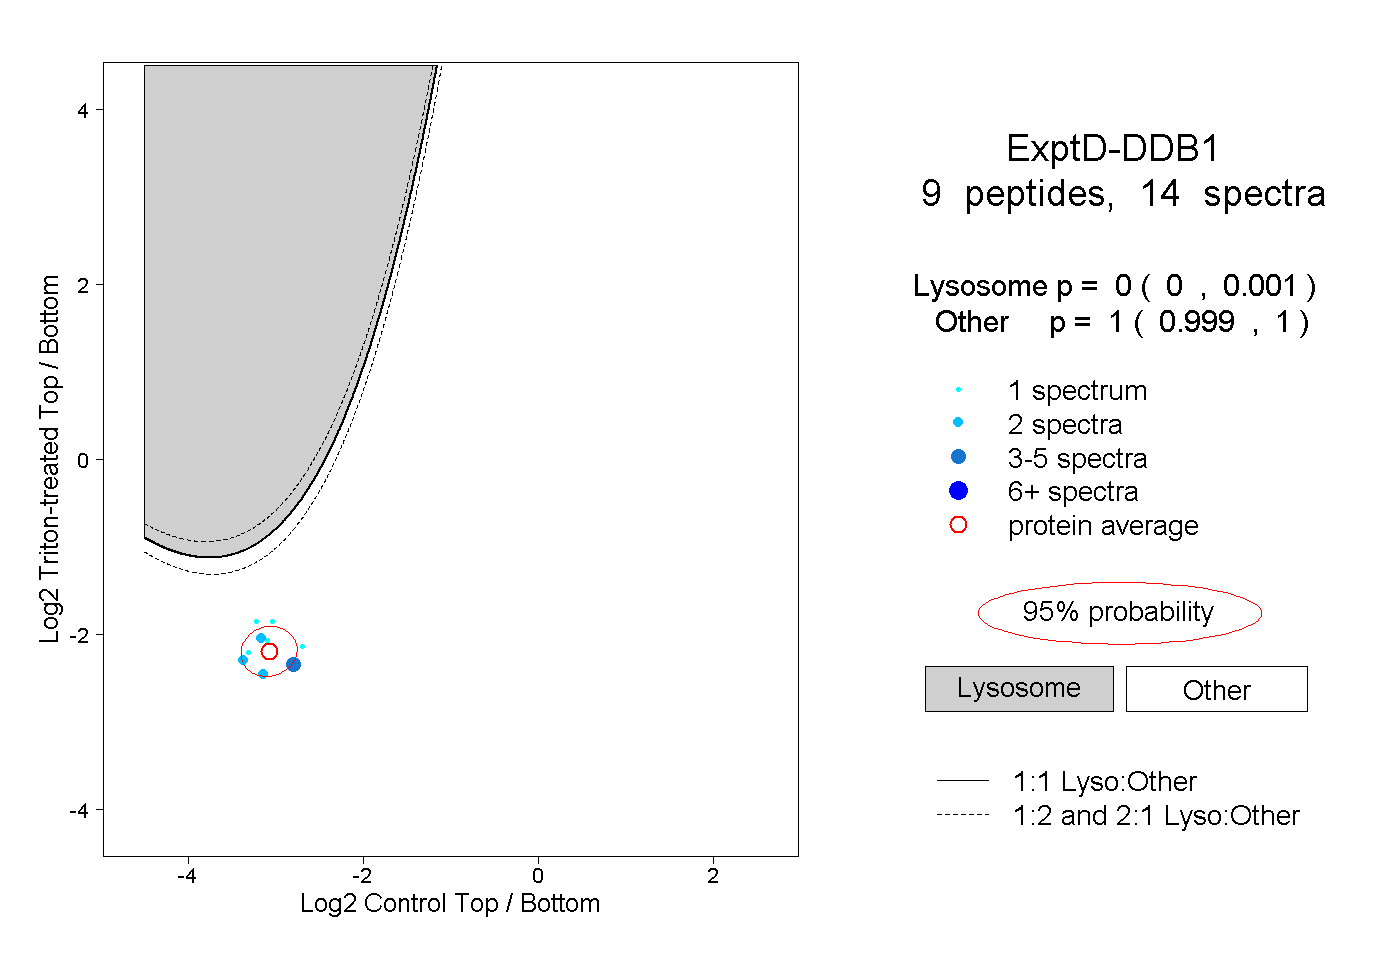
0.000 | 0.001
0.999 | 1.000