 10
10peptides
spectra
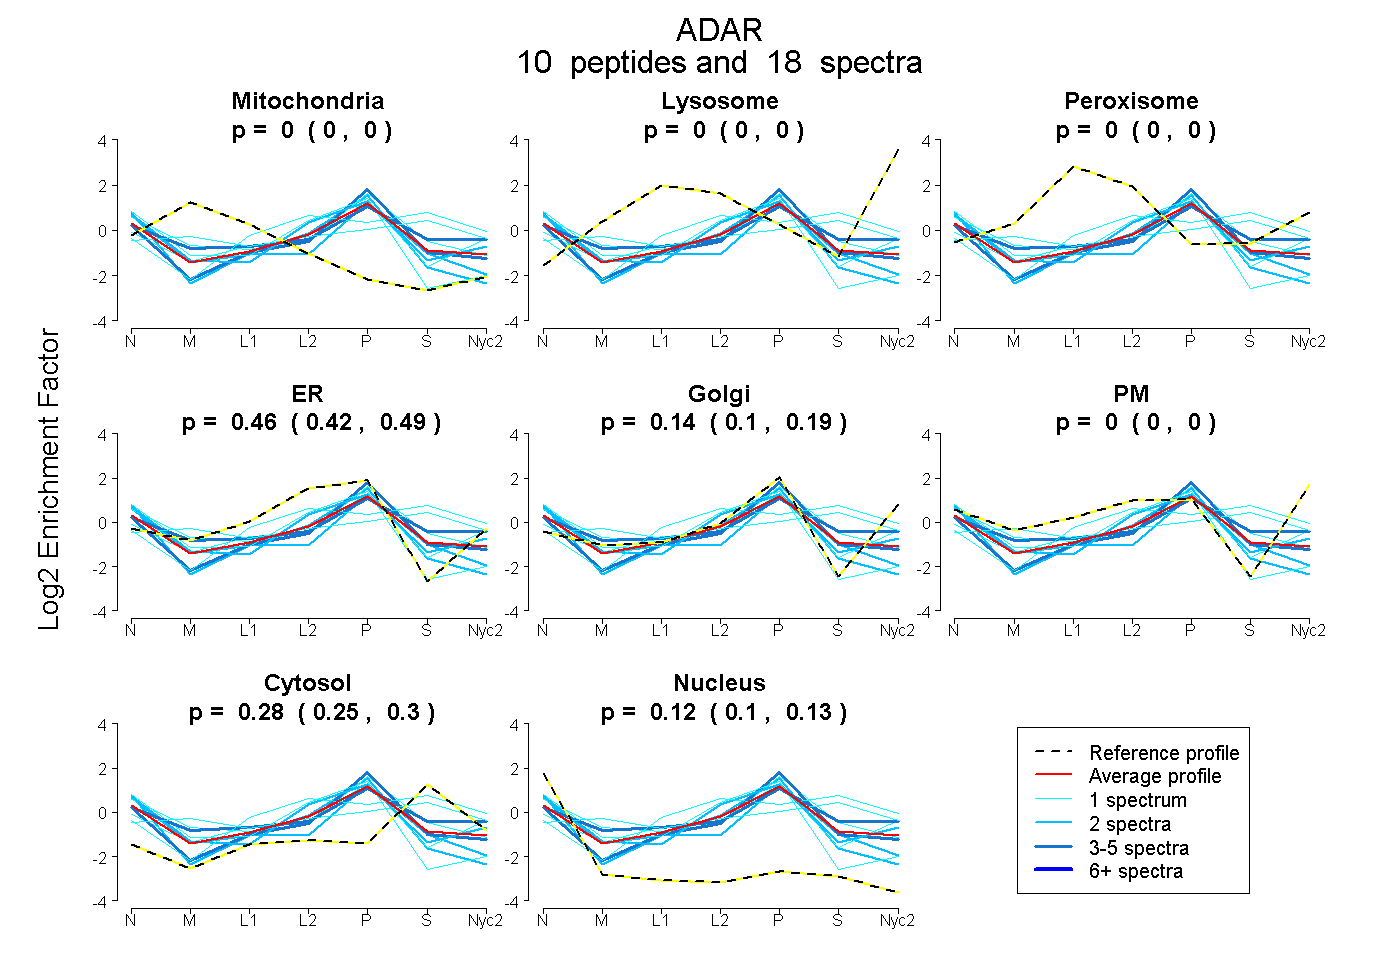
0.000 | 0.000
0.000 | 0.000
0.000 | 0.000
0.417 | 0.488
0.098 | 0.186
0.000 | 0.000
0.254 | 0.303
0.102 | 0.131
| Plot | Mito | Lyso | Perox | ER | Golgi | PM | Cytosol | Nucleus | |||||
| Expt A |
10 peptides |
18 spectra |
|
0.000 0.000 | 0.000 |
0.000 0.000 | 0.000 |
0.000 0.000 | 0.000 |
0.457 0.417 | 0.488 |
0.145 0.098 | 0.186 |
0.000 0.000 | 0.000 |
0.280 0.254 | 0.303 |
0.118 0.102 | 0.131 |
| 2 spectra, NIFLQFK | 0.000 | 0.000 | 0.000 | 0.453 | 0.236 | 0.012 | 0.150 | 0.148 | ||
| 1 spectrum, LIDQSGPPHEPK | 0.056 | 0.000 | 0.006 | 0.149 | 0.474 | 0.113 | 0.083 | 0.118 | ||
| 1 spectrum, TMLLLSR | 0.091 | 0.000 | 0.199 | 0.000 | 0.250 | 0.000 | 0.460 | 0.000 | ||
| 2 spectra, AMAILLR | 0.000 | 0.000 | 0.000 | 0.606 | 0.000 | 0.000 | 0.089 | 0.305 | ||
| 4 spectra, LEELGEGK | 0.000 | 0.000 | 0.000 | 0.314 | 0.309 | 0.000 | 0.245 | 0.132 | ||
| 3 spectra, QMAAEEAMK | 0.022 | 0.000 | 0.070 | 0.136 | 0.386 | 0.034 | 0.316 | 0.034 | ||
| 1 spectrum, SQGFR | 0.000 | 0.000 | 0.172 | 0.259 | 0.000 | 0.026 | 0.542 | 0.000 | ||
| 2 spectra, DVNAVLIDLER | 0.000 | 0.000 | 0.000 | 0.381 | 0.153 | 0.000 | 0.202 | 0.264 | ||
| 1 spectrum, NSIFELAR | 0.000 | 0.000 | 0.000 | 0.726 | 0.000 | 0.000 | 0.000 | 0.274 | ||
| 1 spectrum, ATTAYALAR | 0.000 | 0.000 | 0.000 | 0.381 | 0.222 | 0.000 | 0.357 | 0.041 |
| Plot | Lyso | Other | |||||||||||
| Expt C |
2 peptides |
5 spectra |
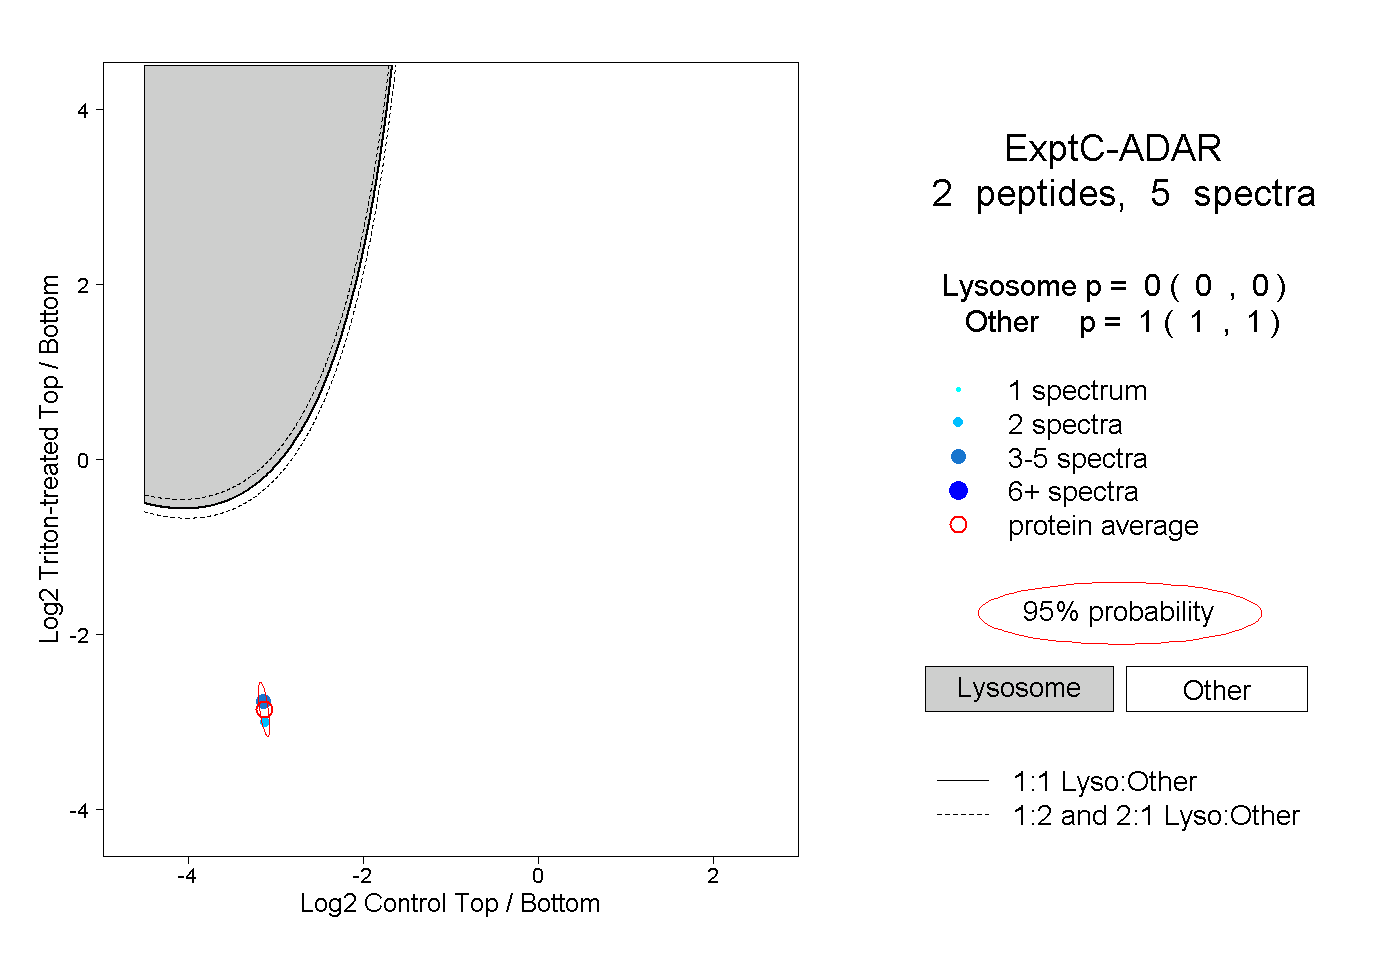 |
0.000 0.000 | 0.000 |
1.000 1.000 | 1.000 |