 6
6peptides
spectra
0.000 | 0.000
0.000 | 0.000
0.000 | 0.000
0.564 | 0.645
0.277 | 0.378
0.000 | 0.000
0.000 | 0.000
0.048 | 0.073
3peptides
spectra
0.000 | 0.000
1.000 | 1.000
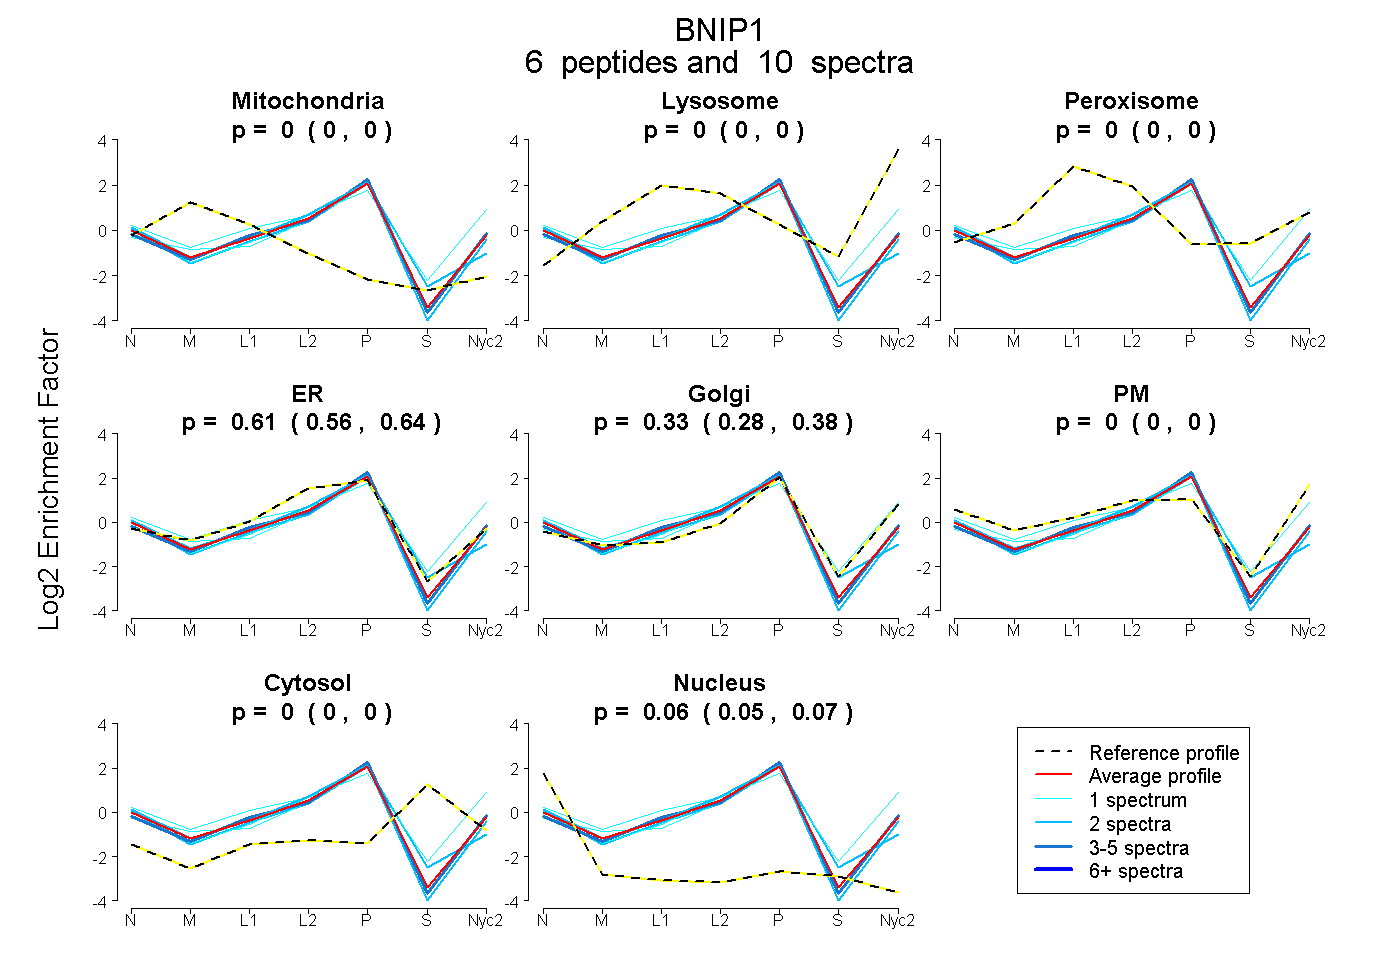
| Plot | Mito | Lyso | Perox | ER | Golgi | PM | Cytosol | Nucleus | |||||
| Expt A |
6 peptides |
10 spectra |
|
0.000 0.000 | 0.000 |
0.000 0.000 | 0.000 |
0.000 0.000 | 0.000 |
0.607 0.564 | 0.645 |
0.330 0.277 | 0.378 |
0.000 0.000 | 0.000 |
0.000 0.000 | 0.000 |
0.062 0.048 | 0.073 |
||
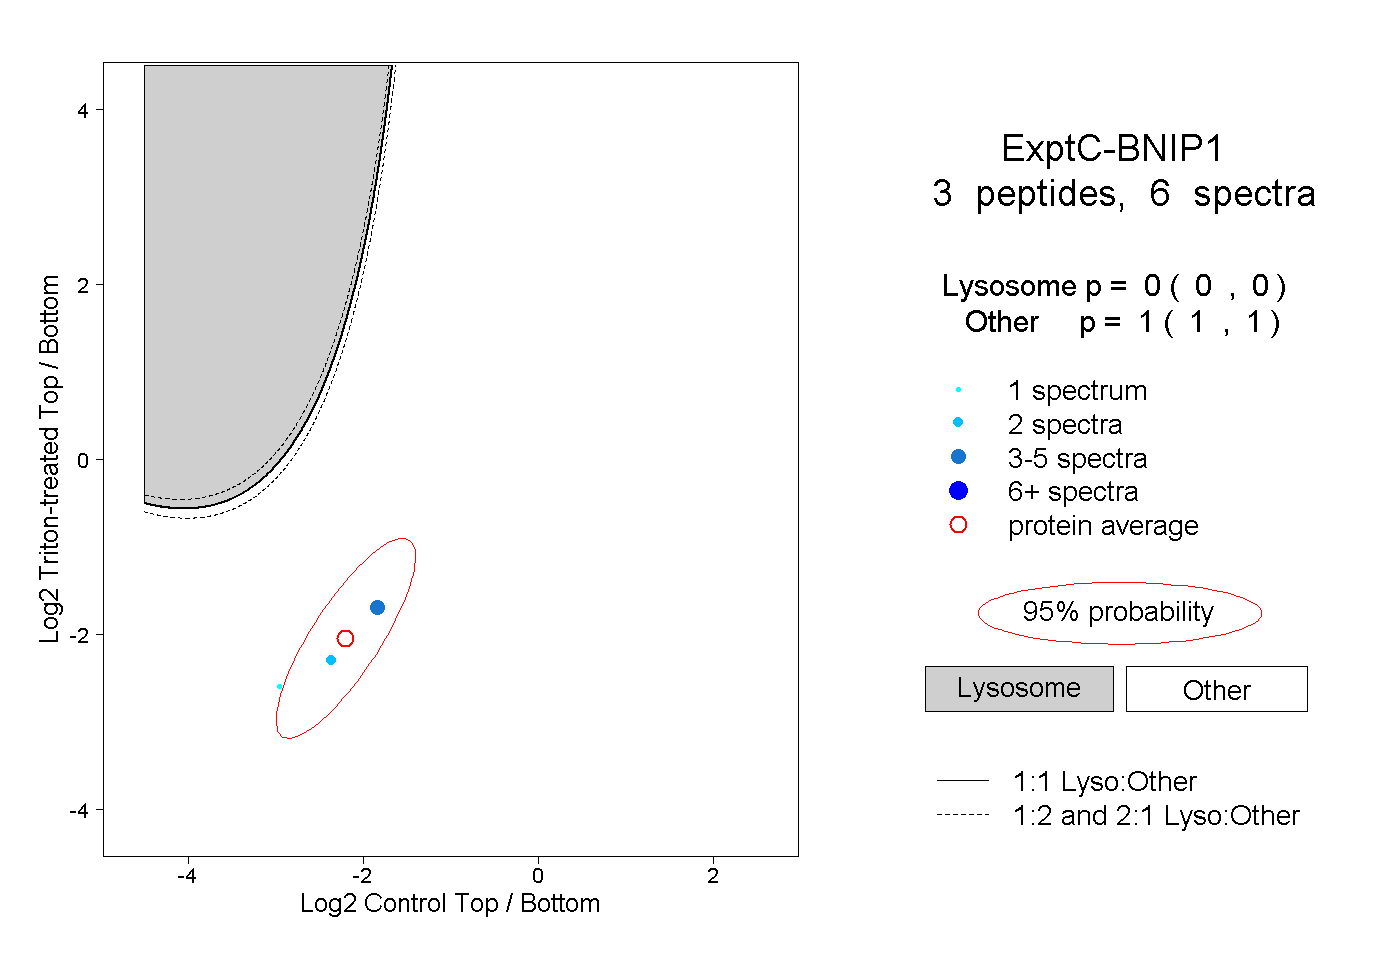
| Plot | Lyso | Other | |||||||||||
| Expt C |
3 peptides |
6 spectra |
|
0.000 0.000 | 0.000 |
1.000 1.000 | 1.000 |