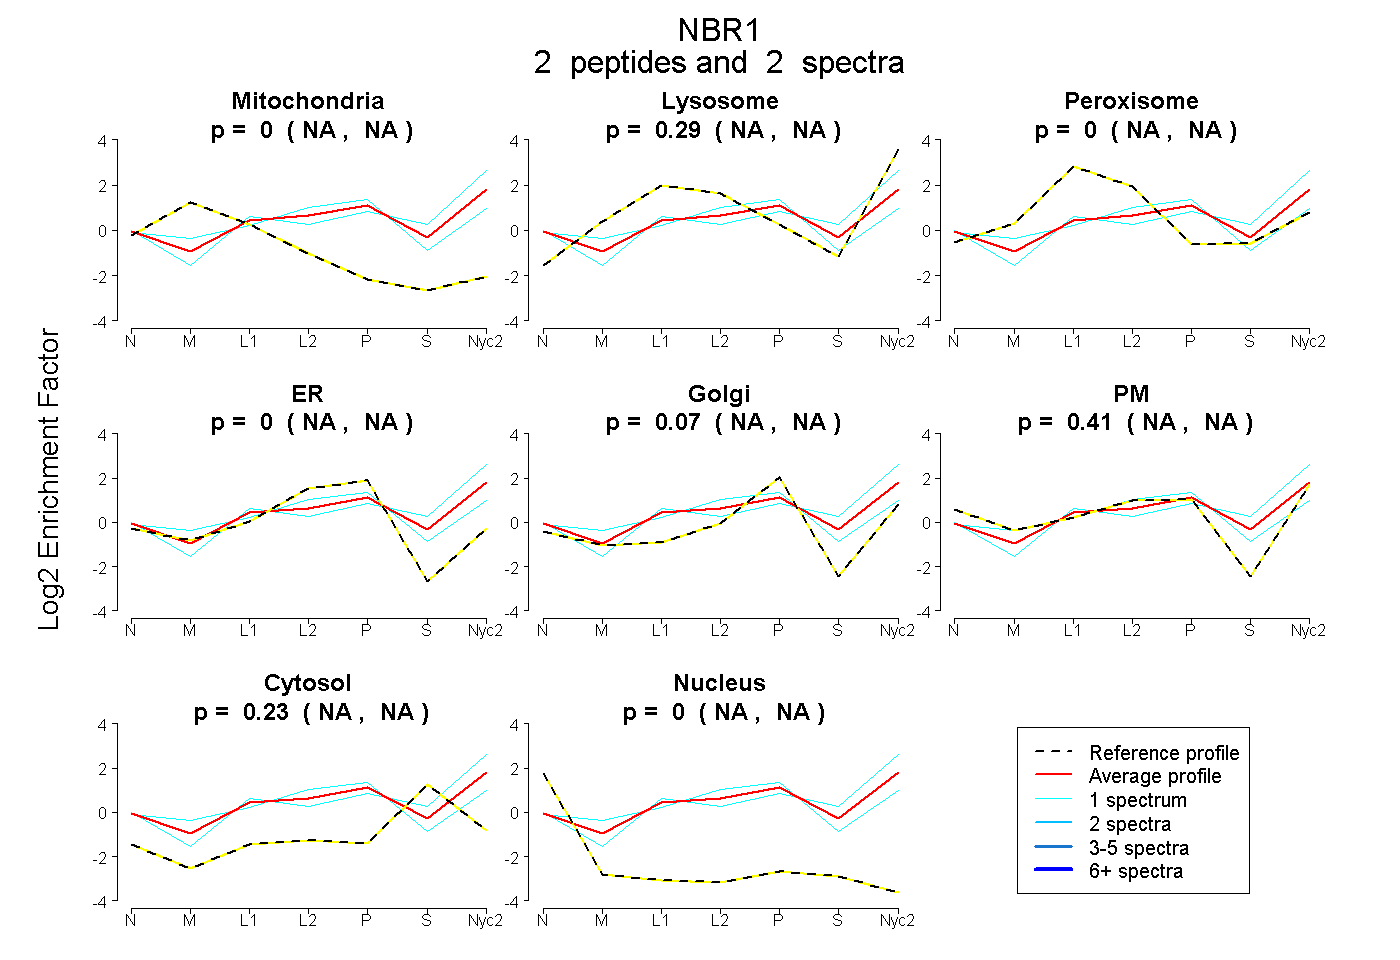
 2
2peptides
spectra
NA | NA
NA | NA
NA | NA
NA | NA
NA | NA
NA | NA
NA | NA
NA | NA
| Plot | Mito | Lyso | Perox | ER | Golgi | PM | Cytosol | Nucleus | |||||
| Expt A |
2 peptides |
2 spectra |
|
0.000 NA | NA |
0.293 NA | NA |
0.000 NA | NA |
0.000 NA | NA |
0.068 NA | NA |
0.406 NA | NA |
0.232 NA | NA |
0.000 NA | NA |
| 1 spectrum, SLTLDAAPDHNPPCR | 0.000 | 0.069 | 0.235 | 0.094 | 0.332 | 0.191 | 0.079 | 0.000 | ||
| 1 spectrum, TTEEPTAEAR | 0.000 | 0.419 | 0.000 | 0.000 | 0.000 | 0.280 | 0.300 | 0.000 |
| Plot | Lyso | Other | |||||||||||
| Expt C |
10 peptides |
16 spectra |
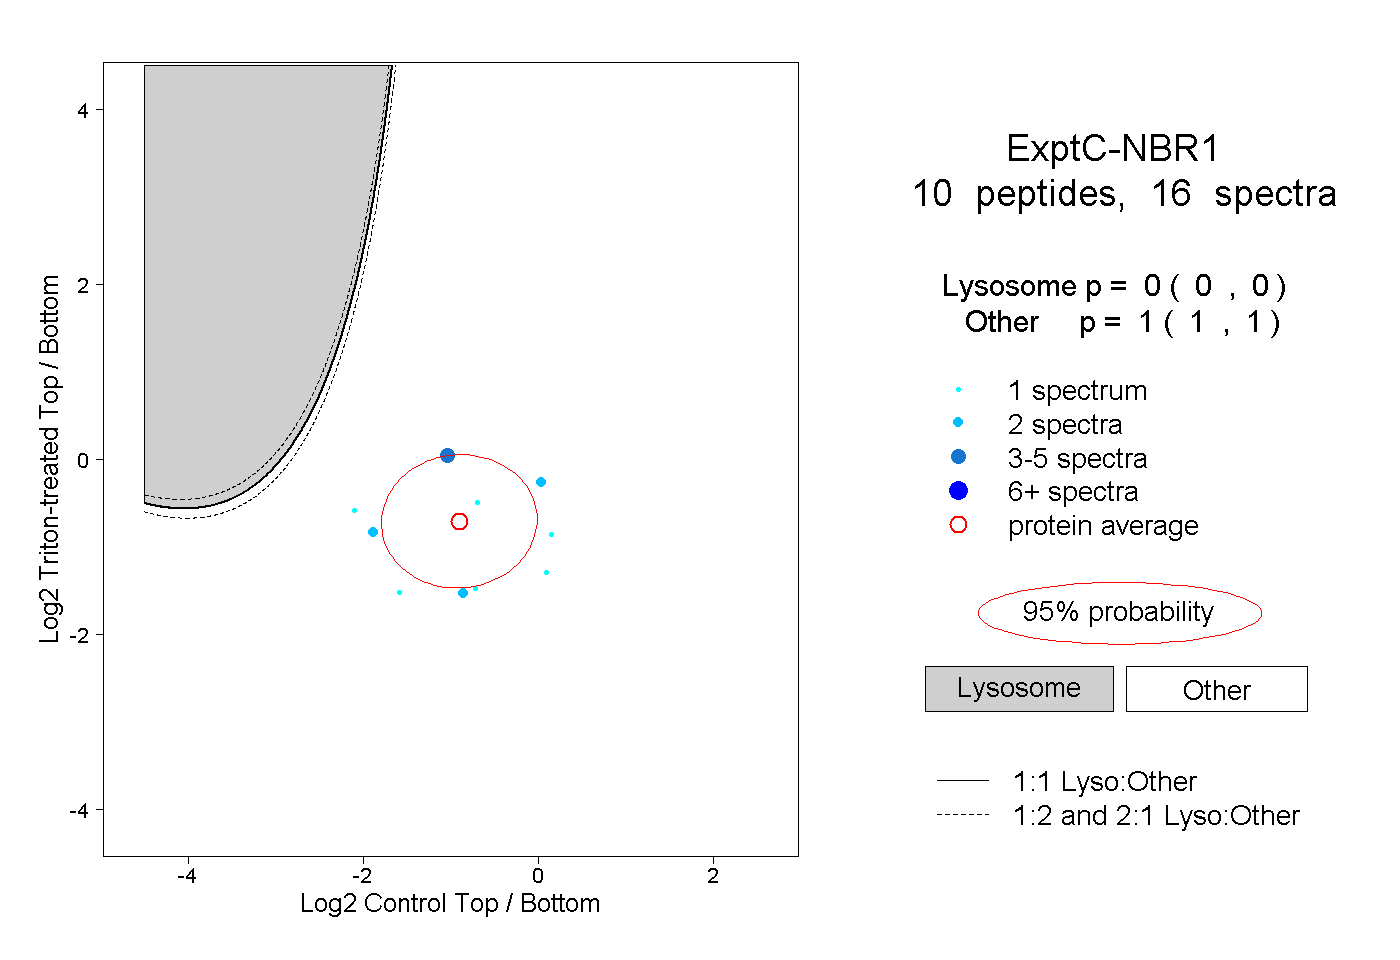 |
0.000 0.000 | 0.000 |
1.000 1.000 | 1.000 |