 2
2peptides
spectra
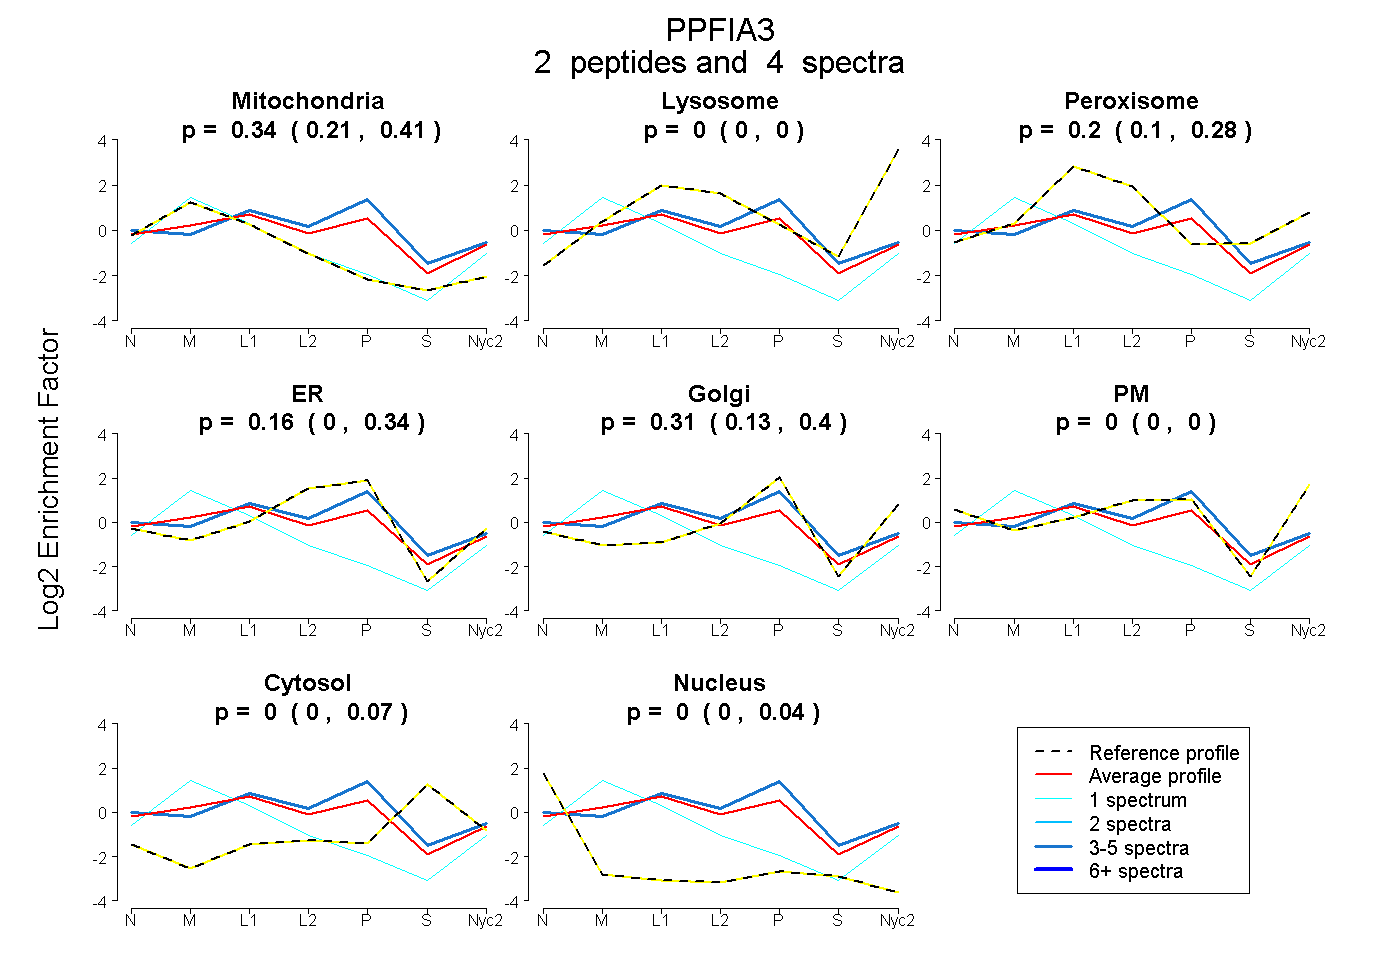
0.213 | 0.412
0.000 | 0.000
0.101 | 0.281
0.000 | 0.341
0.127 | 0.404
0.000 | 0.000
0.000 | 0.069
0.000 | 0.042
| Plot | Mito | Lyso | Perox | ER | Golgi | PM | Cytosol | Nucleus | |||||
| Expt A |
2 peptides |
4 spectra |
|
0.340 0.213 | 0.412 |
0.000 0.000 | 0.000 |
0.197 0.101 | 0.281 |
0.156 0.000 | 0.341 |
0.307 0.127 | 0.404 |
0.000 0.000 | 0.000 |
0.000 0.000 | 0.069 |
0.000 0.000 | 0.042 |
| 3 spectra, LAIQEMVSLTSPSAPASSR | 0.142 | 0.000 | 0.222 | 0.331 | 0.269 | 0.000 | 0.037 | 0.000 | ||
| 1 spectrum, VMGWVSGLGLK | 0.887 | 0.112 | 0.000 | 0.000 | 0.001 | 0.000 | 0.000 | 0.000 |
| Plot | Lyso | Other | |||||||||||
| Expt C |
3 peptides |
5 spectra |
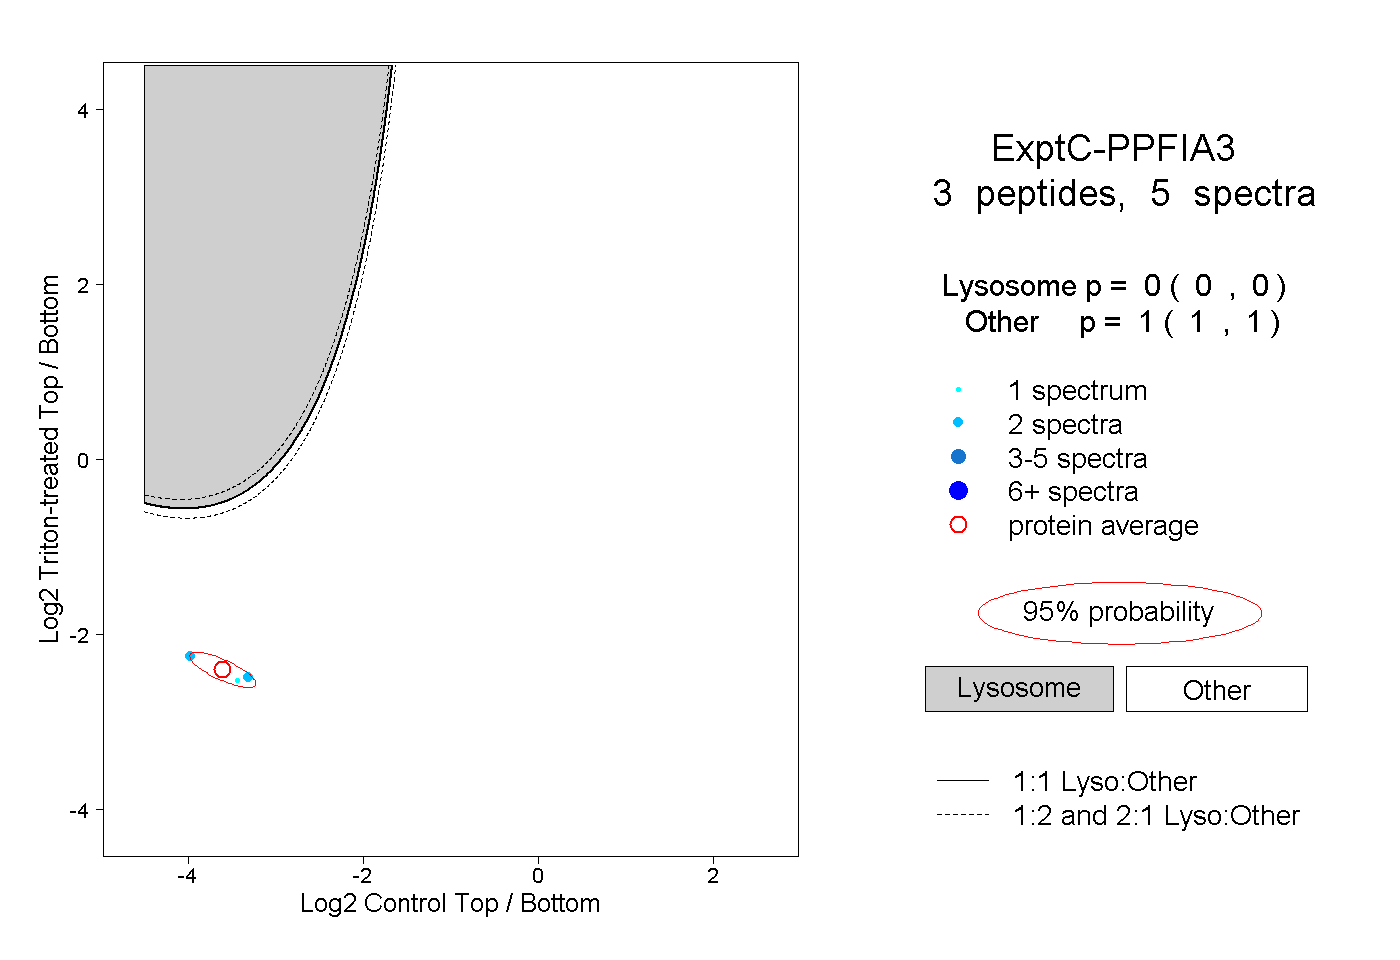 |
0.000 0.000 | 0.000 |
1.000 1.000 | 1.000 |