 2
2peptides
spectra

NA | NA
NA | NA
NA | NA
NA | NA
NA | NA
NA | NA
NA | NA
NA | NA
| Plot | Mito | Lyso | Perox | ER | Golgi | PM | Cytosol | Nucleus | |||||
| Expt A |
2 peptides |
2 spectra |
|
0.000 NA | NA |
0.581 NA | NA |
0.000 NA | NA |
0.000 NA | NA |
0.143 NA | NA |
0.193 NA | NA |
0.083 NA | NA |
0.000 NA | NA |
| 1 spectrum, EPLQGTLLGYR | 0.000 | 0.470 | 0.009 | 0.000 | 0.000 | 0.415 | 0.106 | 0.000 | ||
| 1 spectrum, LLPHTPYHIR | 0.000 | 0.662 | 0.000 | 0.000 | 0.289 | 0.000 | 0.050 | 0.000 |
| Plot | Lyso | Other | |||||||||||
| Expt C |
3 peptides |
3 spectra |
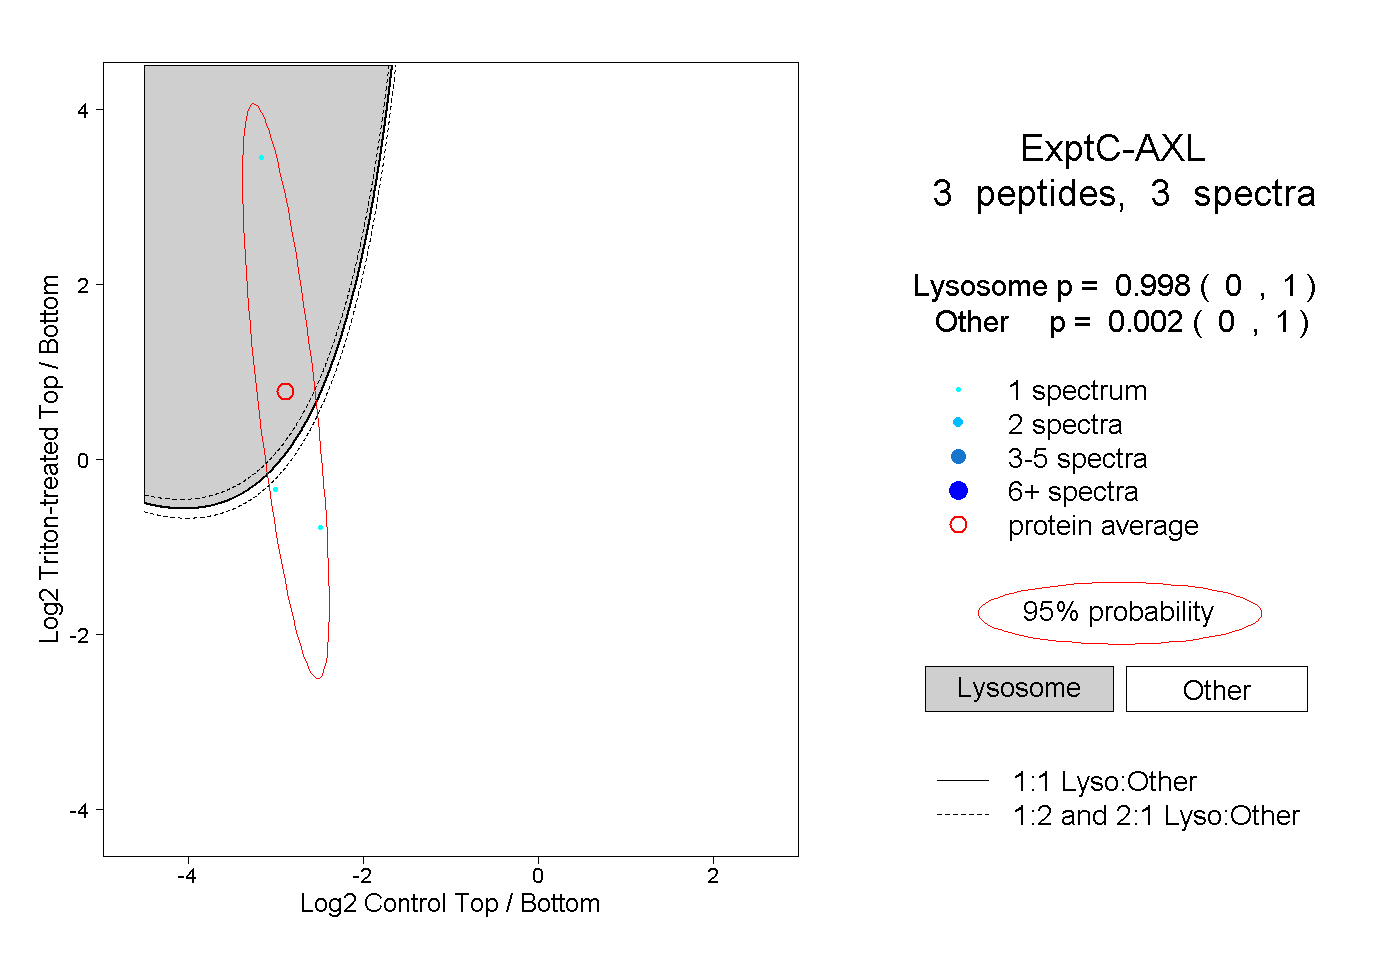 |
0.998 0.000 | 1.000 |
0.002 0.000 | 1.000 |