 3
3peptides
spectra
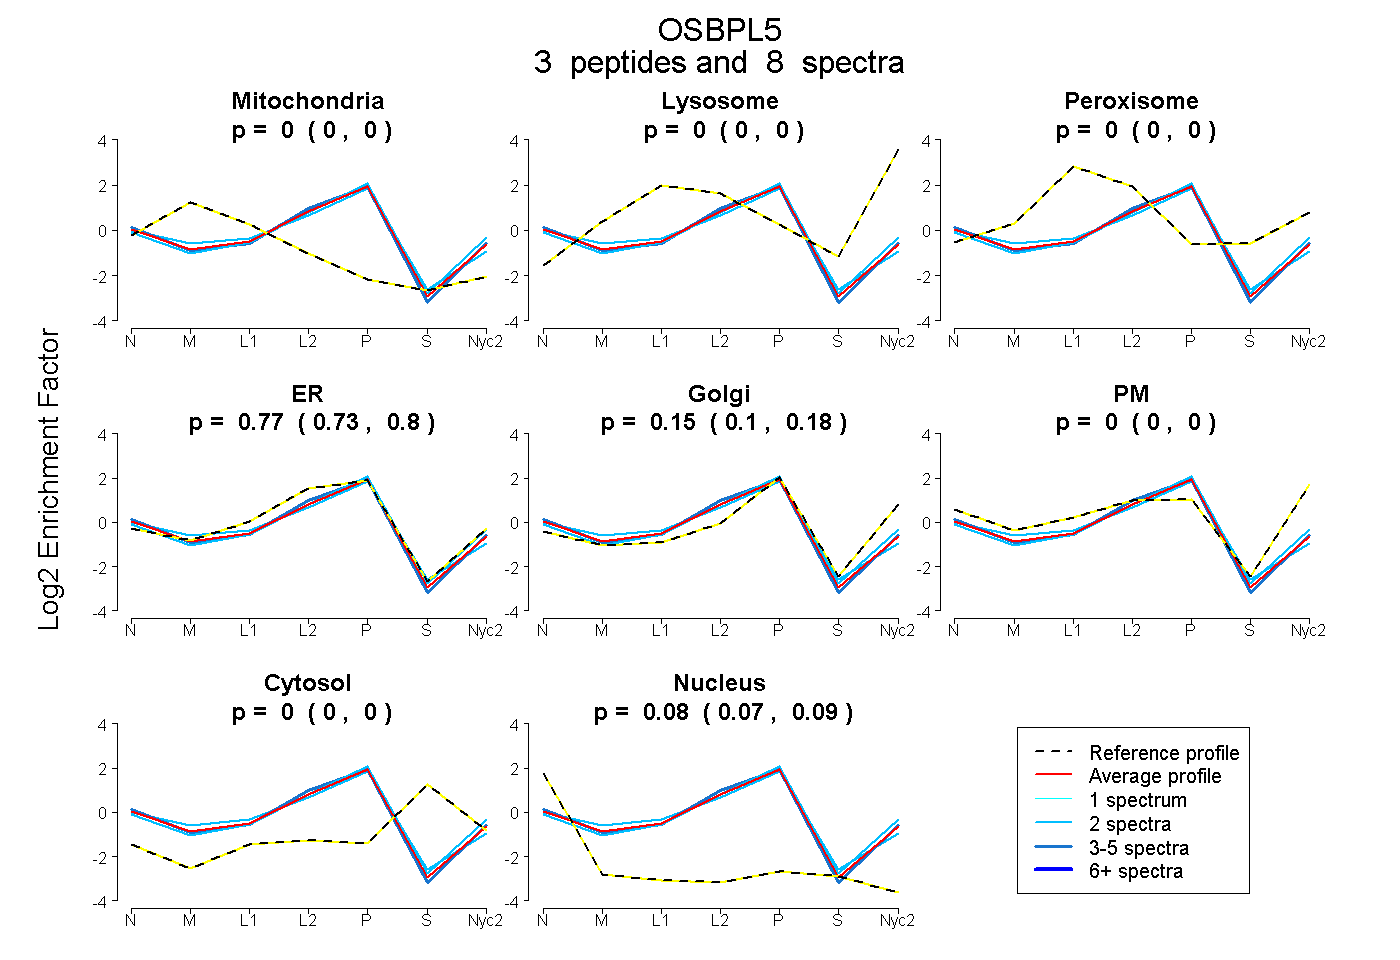
0.000 | 0.000
0.000 | 0.000
0.000 | 0.000
0.732 | 0.804
0.102 | 0.183
0.000 | 0.000
0.000 | 0.000
0.073 | 0.092
| Plot | Mito | Lyso | Perox | ER | Golgi | PM | Cytosol | Nucleus | |||||
| Expt A |
3 peptides |
8 spectra |
|
0.000 0.000 | 0.000 |
0.000 0.000 | 0.000 |
0.000 0.000 | 0.000 |
0.769 0.732 | 0.804 |
0.148 0.102 | 0.183 |
0.000 0.000 | 0.000 |
0.000 0.000 | 0.000 |
0.083 0.073 | 0.092 |
| 2 spectra, KPYNPILGETFR | 0.041 | 0.000 | 0.000 | 0.785 | 0.090 | 0.000 | 0.000 | 0.085 | ||
| 2 spectra, WYLSGFYK | 0.000 | 0.000 | 0.000 | 0.659 | 0.287 | 0.000 | 0.000 | 0.054 | ||
| 4 spectra, LTFLNR | 0.000 | 0.000 | 0.000 | 0.816 | 0.099 | 0.000 | 0.000 | 0.084 |
| Plot | Lyso | Other | |||||||||||
| Expt C |
4 peptides |
7 spectra |
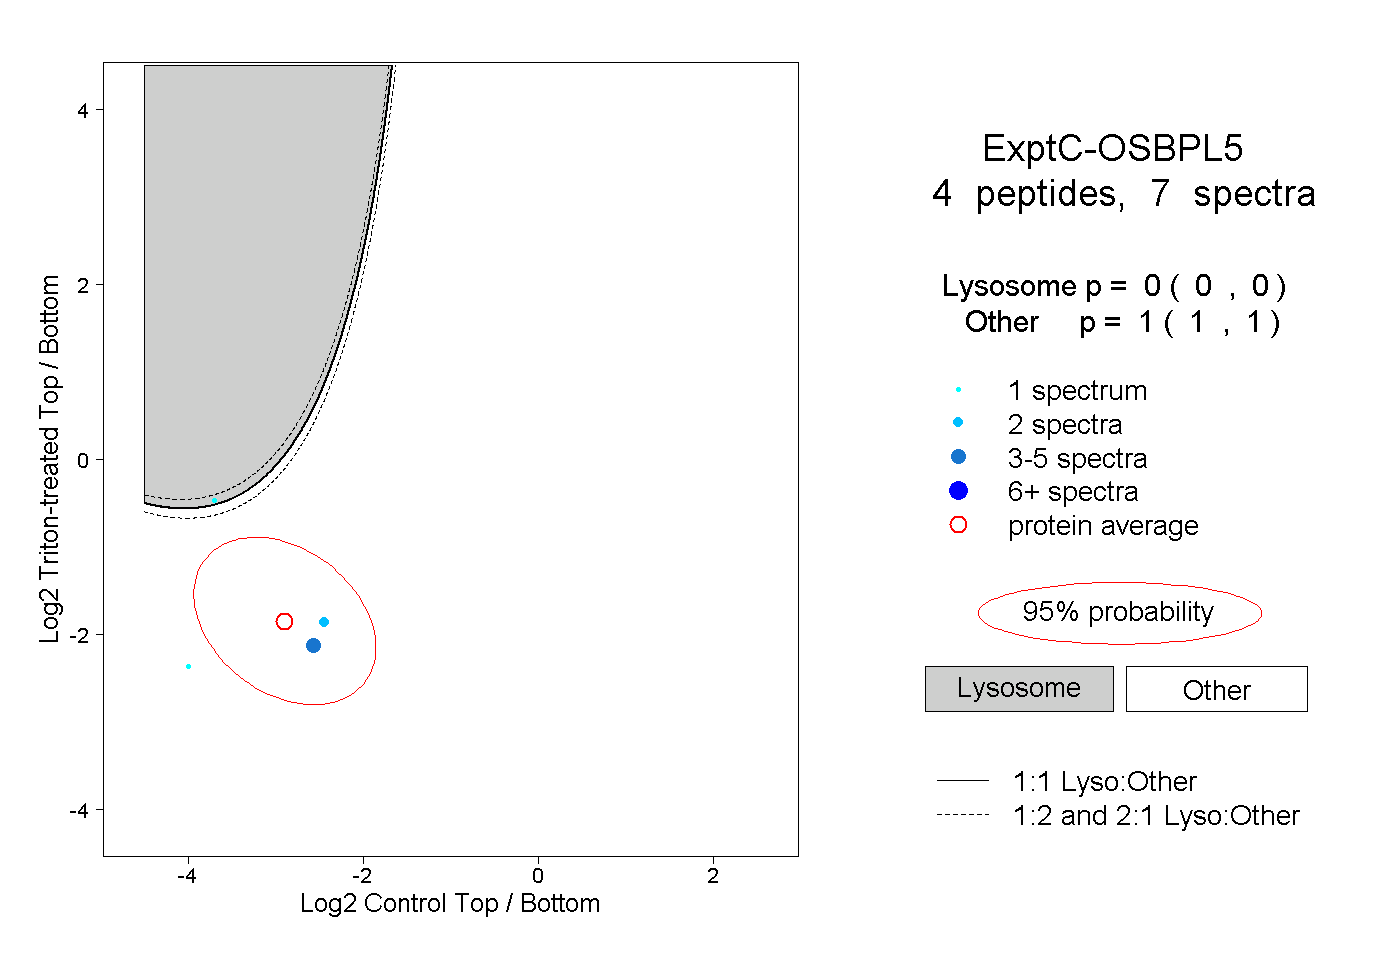 |
0.000 0.000 | 0.000 |
1.000 1.000 | 1.000 |