 1
1peptide
spectrum
NA | NA
NA | NA
NA | NA
NA | NA
NA | NA
NA | NA
NA | NA
NA | NA
1peptide
spectra
0.000 | 0.001
0.999 | 1.000
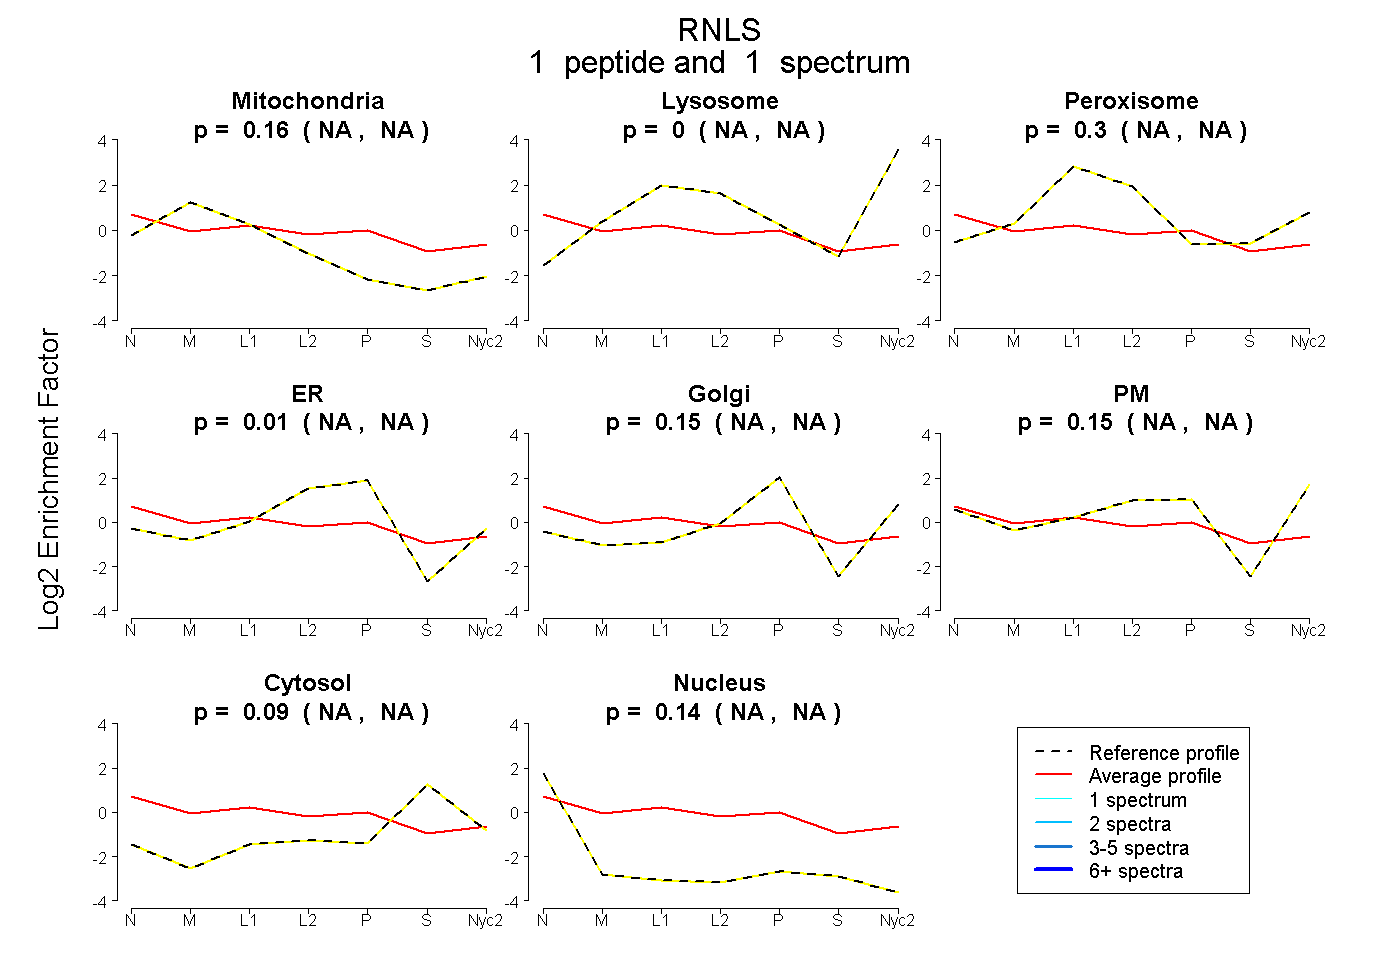
| Plot | Mito | Lyso | Perox | ER | Golgi | PM | Cytosol | Nucleus | |||||
| Expt A |
1 peptide |
1 spectrum |
|
0.156 NA | NA |
0.000 NA | NA |
0.304 NA | NA |
0.012 NA | NA |
0.148 NA | NA |
0.150 NA | NA |
0.086 NA | NA |
0.143 NA | NA |
||
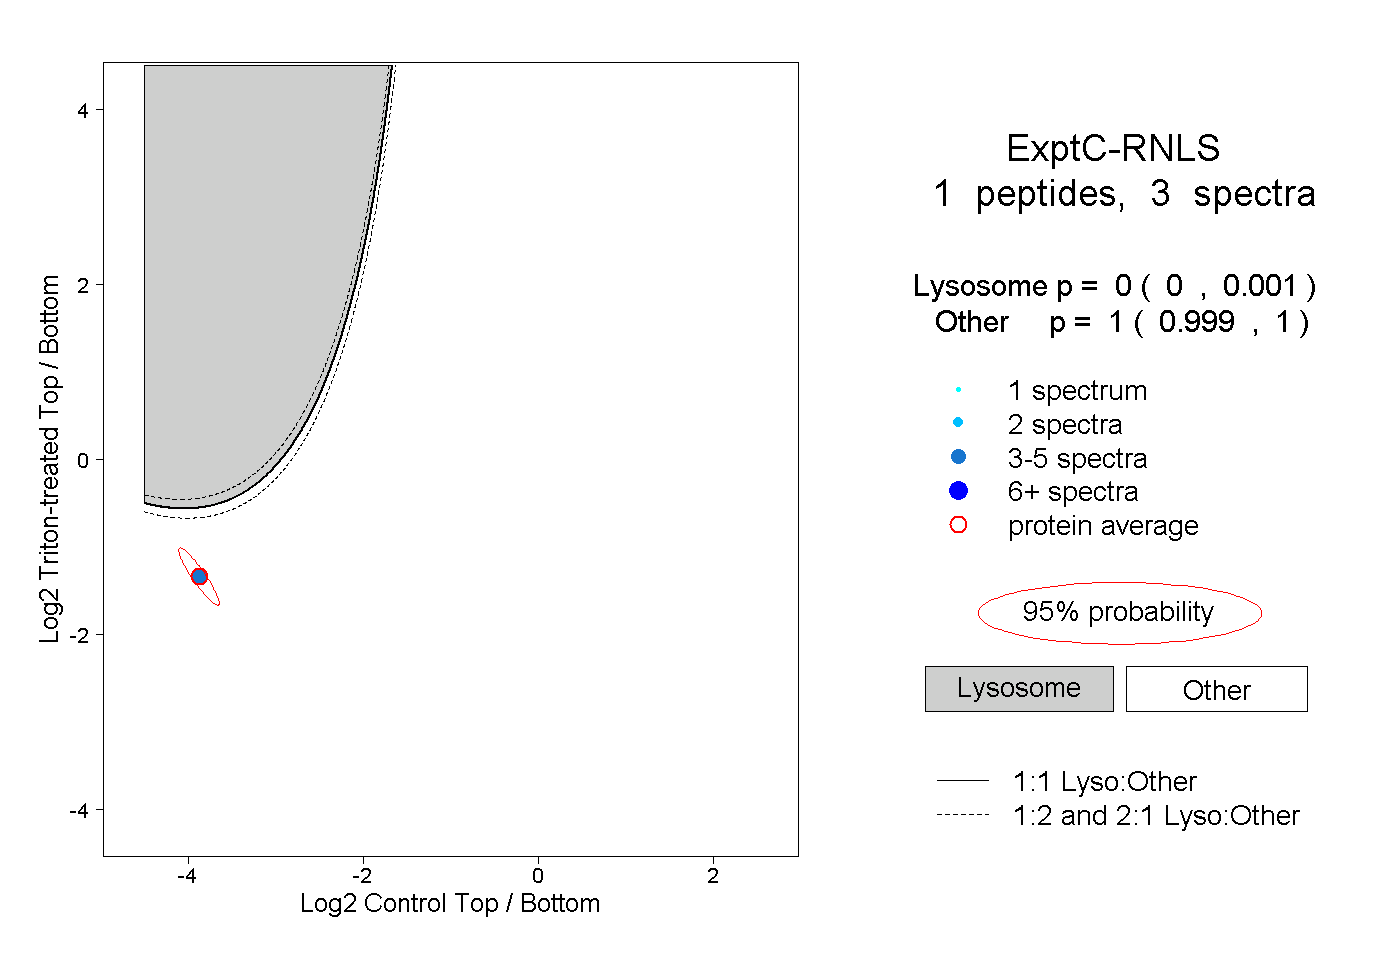
| Plot | Lyso | Other | |||||||||||
| Expt C |
1 peptide |
3 spectra |
|
0.000 0.000 | 0.001 |
1.000 0.999 | 1.000 |