 6
6peptides
spectra
0.086 | 0.157
0.000 | 0.005
0.000 | 0.022
0.000 | 0.000
0.000 | 0.043
0.000 | 0.000
0.811 | 0.871
0.000 | 0.000
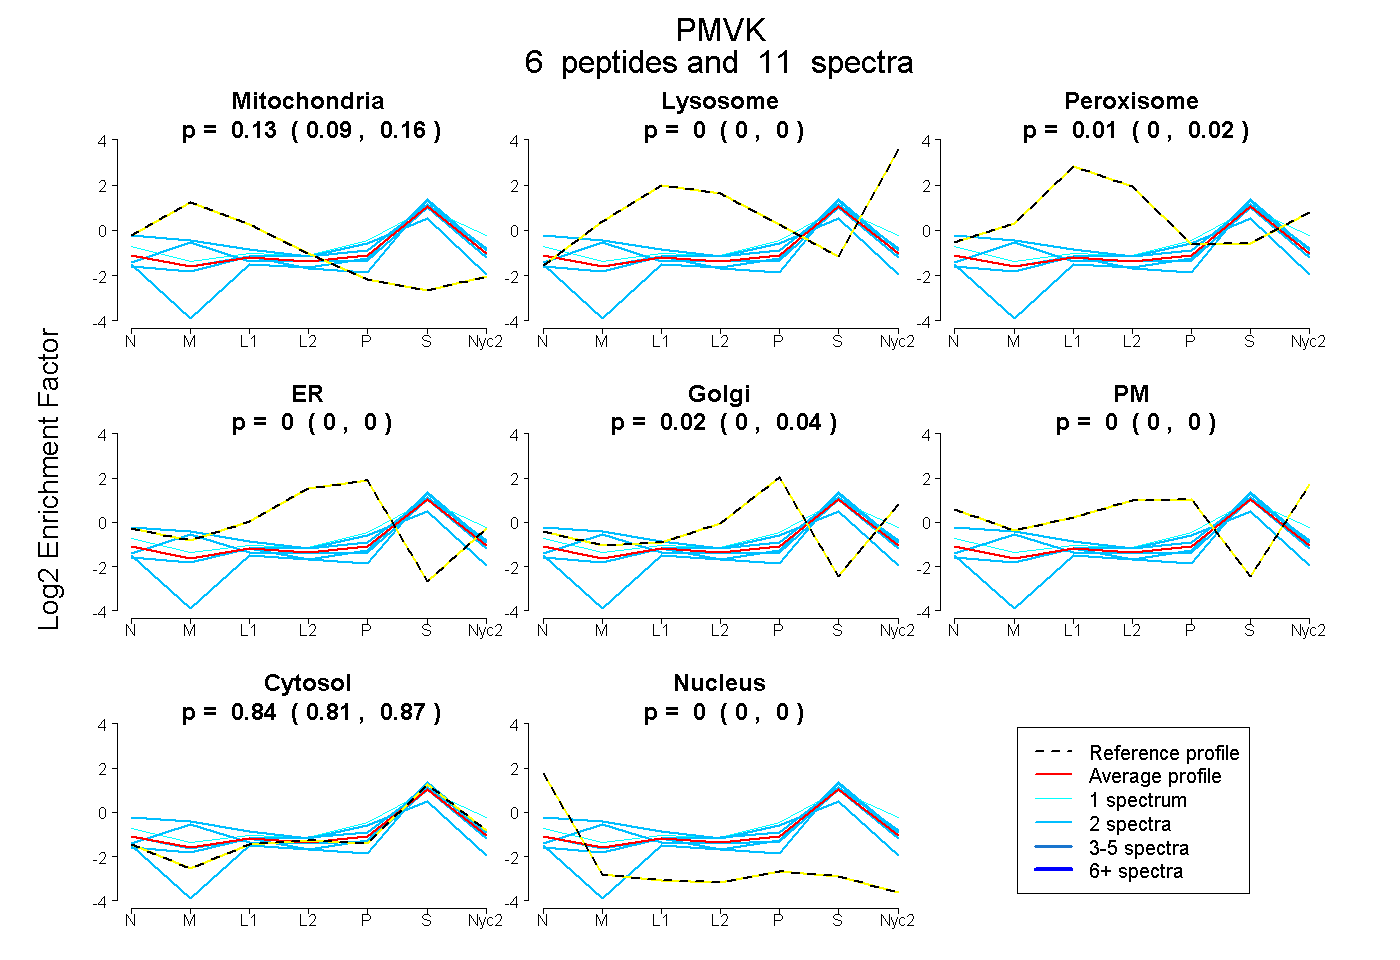
| Plot | Mito | Lyso | Perox | ER | Golgi | PM | Cytosol | Nucleus | |||||
| Expt A |
6 peptides |
11 spectra |
|
0.125 0.086 | 0.157 |
0.000 0.000 | 0.005 |
0.010 0.000 | 0.022 |
0.000 0.000 | 0.000 |
0.021 0.000 | 0.043 |
0.000 0.000 | 0.000 |
0.844 0.811 | 0.871 |
0.000 0.000 | 0.000 |
| 2 spectra, LGGNICAVLR | 0.338 | 0.000 | 0.000 | 0.081 | 0.000 | 0.000 | 0.580 | 0.001 | ||
| 1 spectrum, DMICWGEEK | 0.008 | 0.022 | 0.031 | 0.000 | 0.071 | 0.121 | 0.747 | 0.000 | ||
| 2 spectra, VVASEQSR | 0.061 | 0.000 | 0.052 | 0.000 | 0.055 | 0.000 | 0.832 | 0.000 | ||
| 2 spectra, GWVFTR | 0.095 | 0.000 | 0.000 | 0.000 | 0.000 | 0.000 | 0.905 | 0.000 | ||
| 2 spectra, EHGLDFQK | 0.250 | 0.000 | 0.000 | 0.000 | 0.000 | 0.000 | 0.750 | 0.000 | ||
| 2 spectra, APLGASPR | 0.000 | 0.000 | 0.000 | 0.000 | 0.000 | 0.000 | 0.989 | 0.011 |
| Plot | Mito | Lyso or Perox | ER | Golgi | PM | Cytosol | Nucleus | ||||||
| Expt B |
4 peptides |
8 spectra |
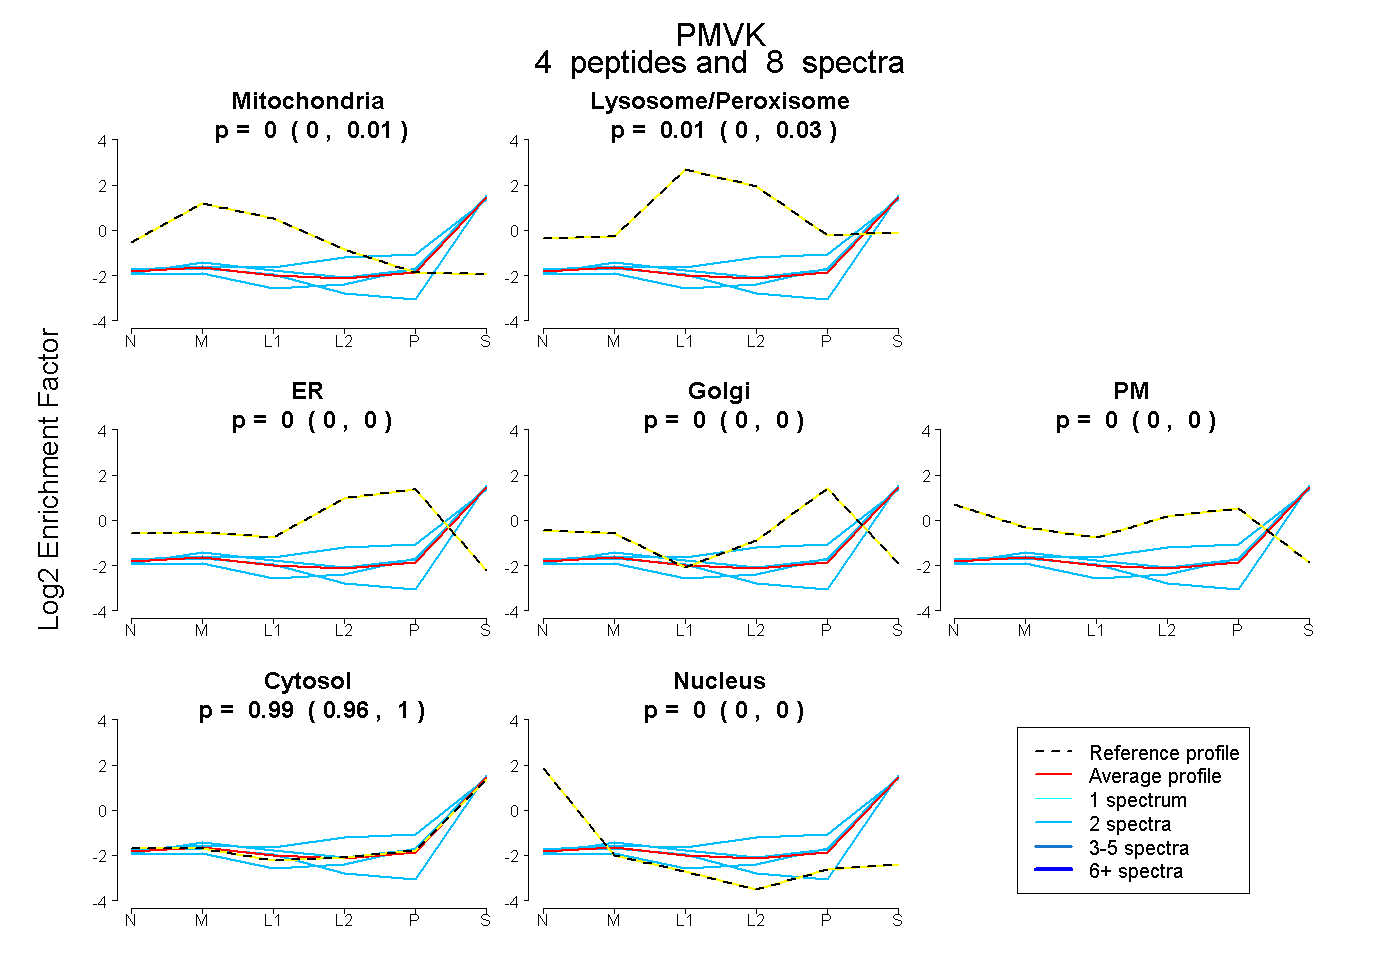 |
0.000 0.000 | 0.011 |
0.013 0.000 | 0.034 |
0.000 0.000 | 0.000 |
0.000 0.000 | 0.000 |
0.000 0.000 | 0.000 |
0.987 0.963 | 1.000 |
0.000 0.000 | 0.000 |
|||
| Plot | Lyso | Other | |||||||||||
| Expt C |
5 peptides |
14 spectra |
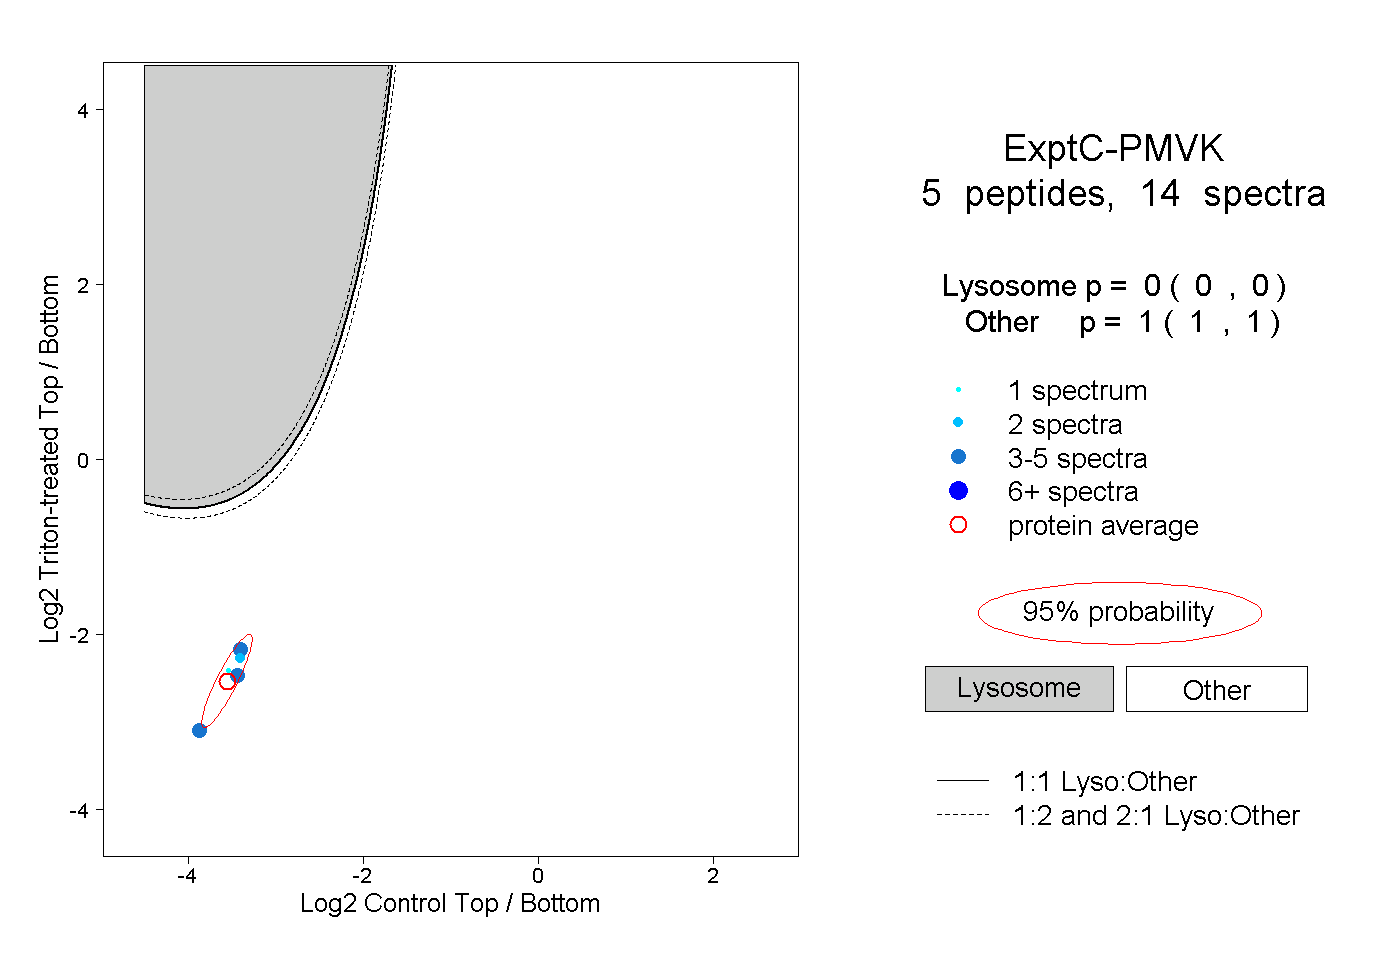 |
0.000 0.000 | 0.000 |
1.000 1.000 | 1.000 |