15
15peptides
spectra
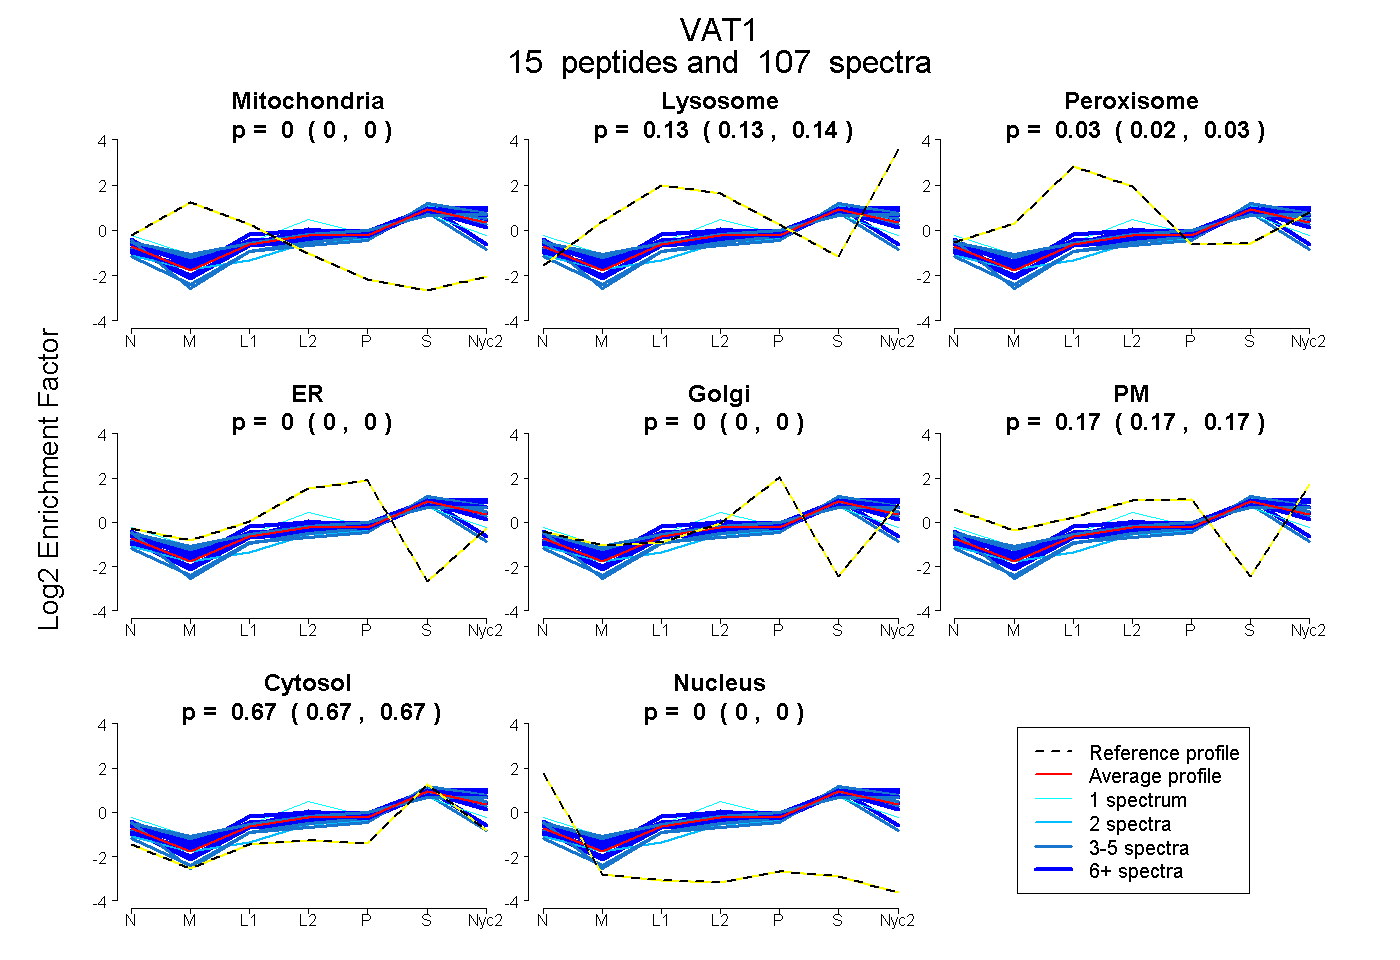
0.000 | 0.000
0.125 | 0.139
0.019 | 0.031
0.000 | 0.000
0.000 | 0.000
0.169 | 0.174
0.668 | 0.671
0.000 | 0.000
14peptides
spectra
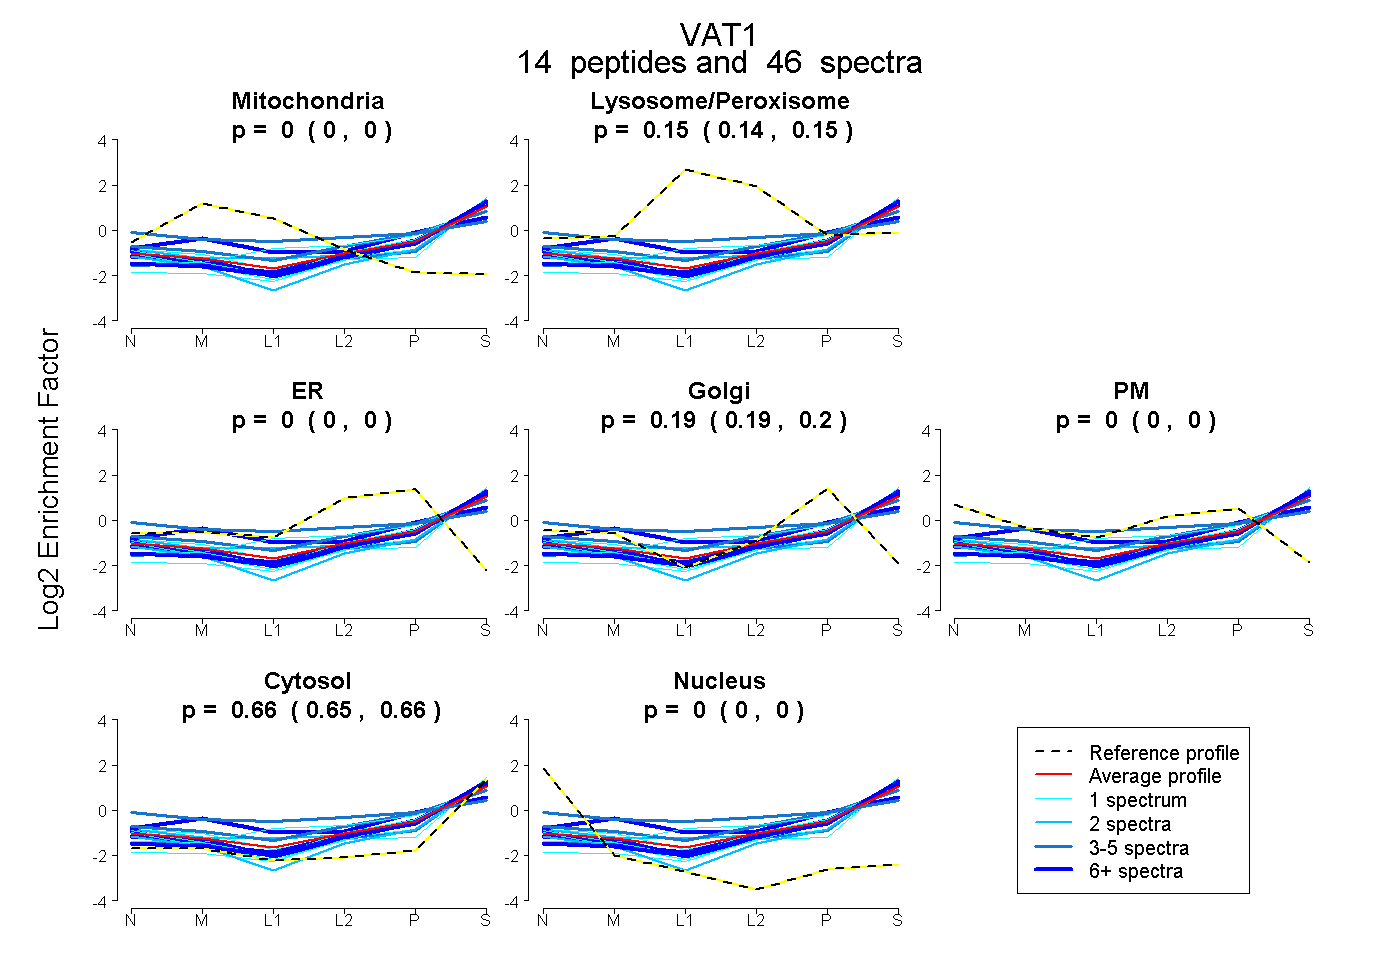
0.000 | 0.000
0.142 | 0.155
0.000 | 0.000
0.188 | 0.201
0.000 | 0.000
0.651 | 0.661
0.000 | 0.000
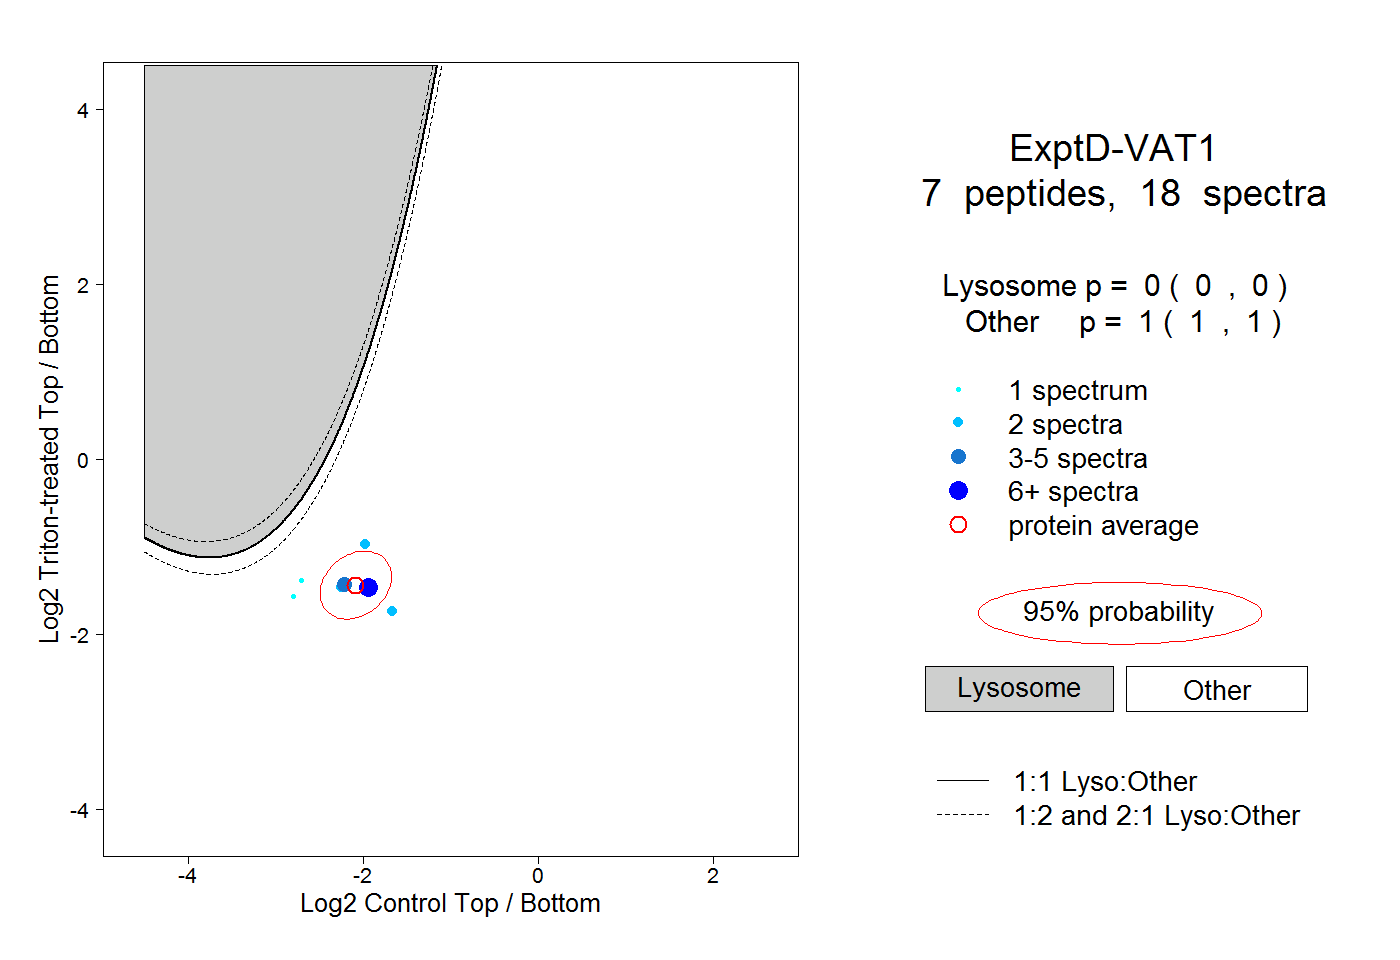
17peptides
spectra
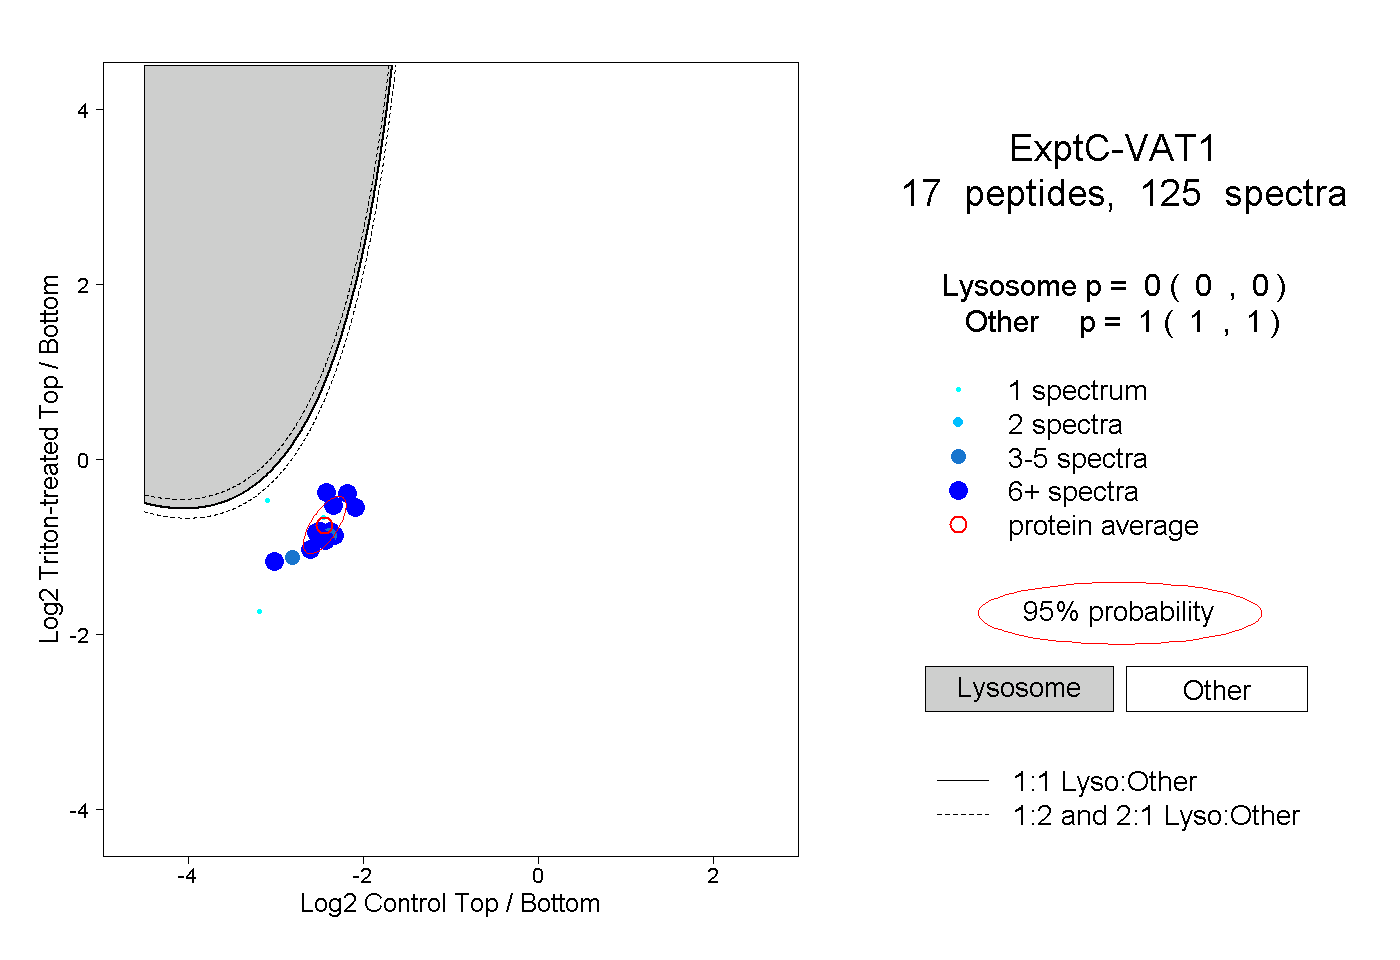
0.000 | 0.000
1.000 | 1.000