16
16peptides
spectra
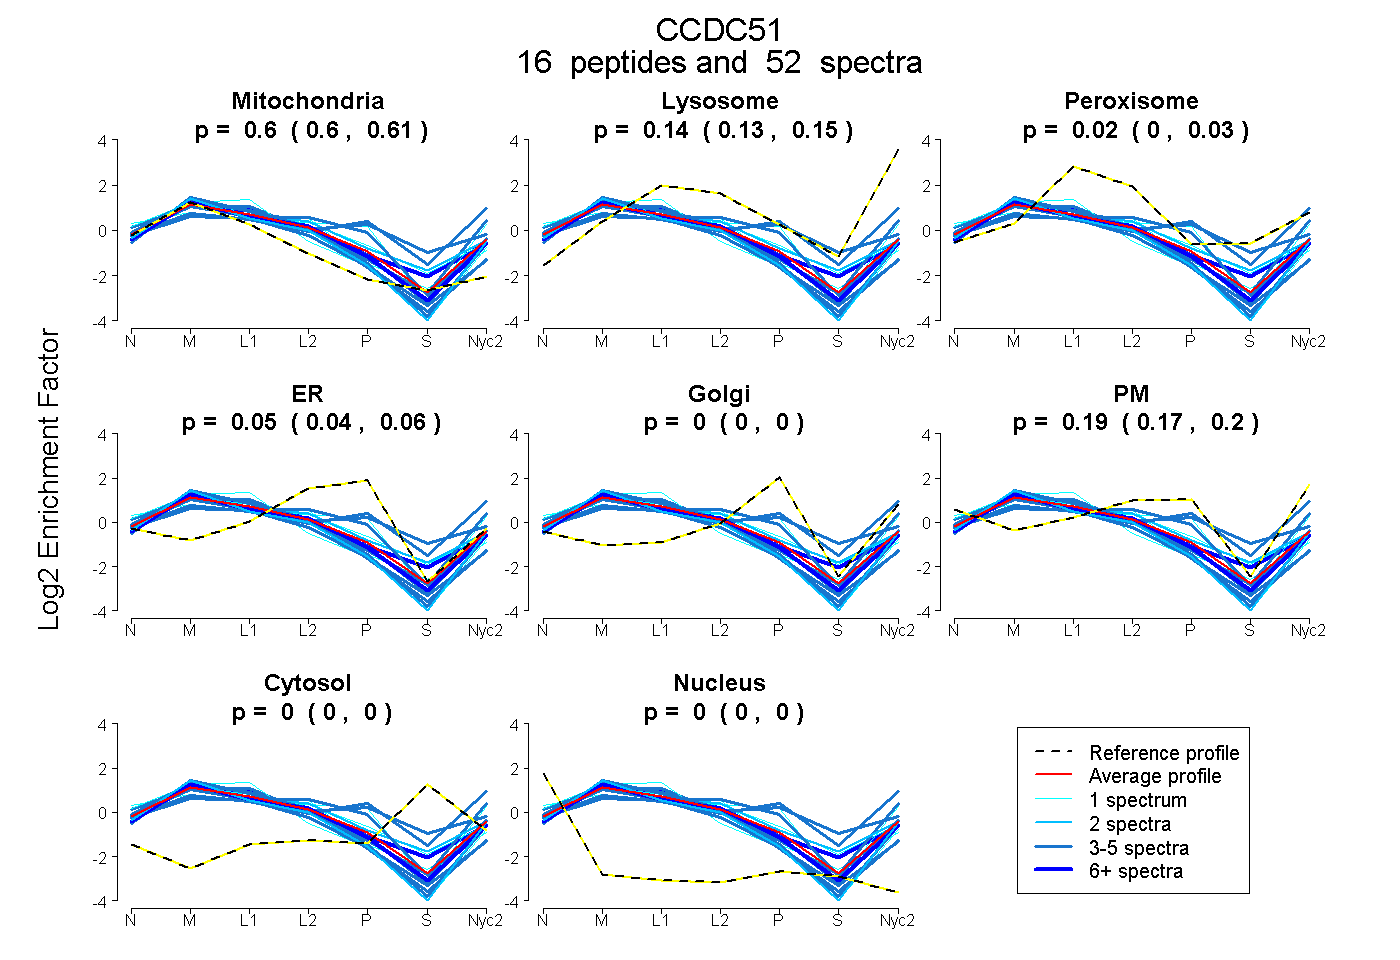
0.597 | 0.611
0.130 | 0.147
0.004 | 0.031
0.036 | 0.064
0.000 | 0.000
0.173 | 0.196
0.000 | 0.000
0.000 | 0.000
6peptides
spectra
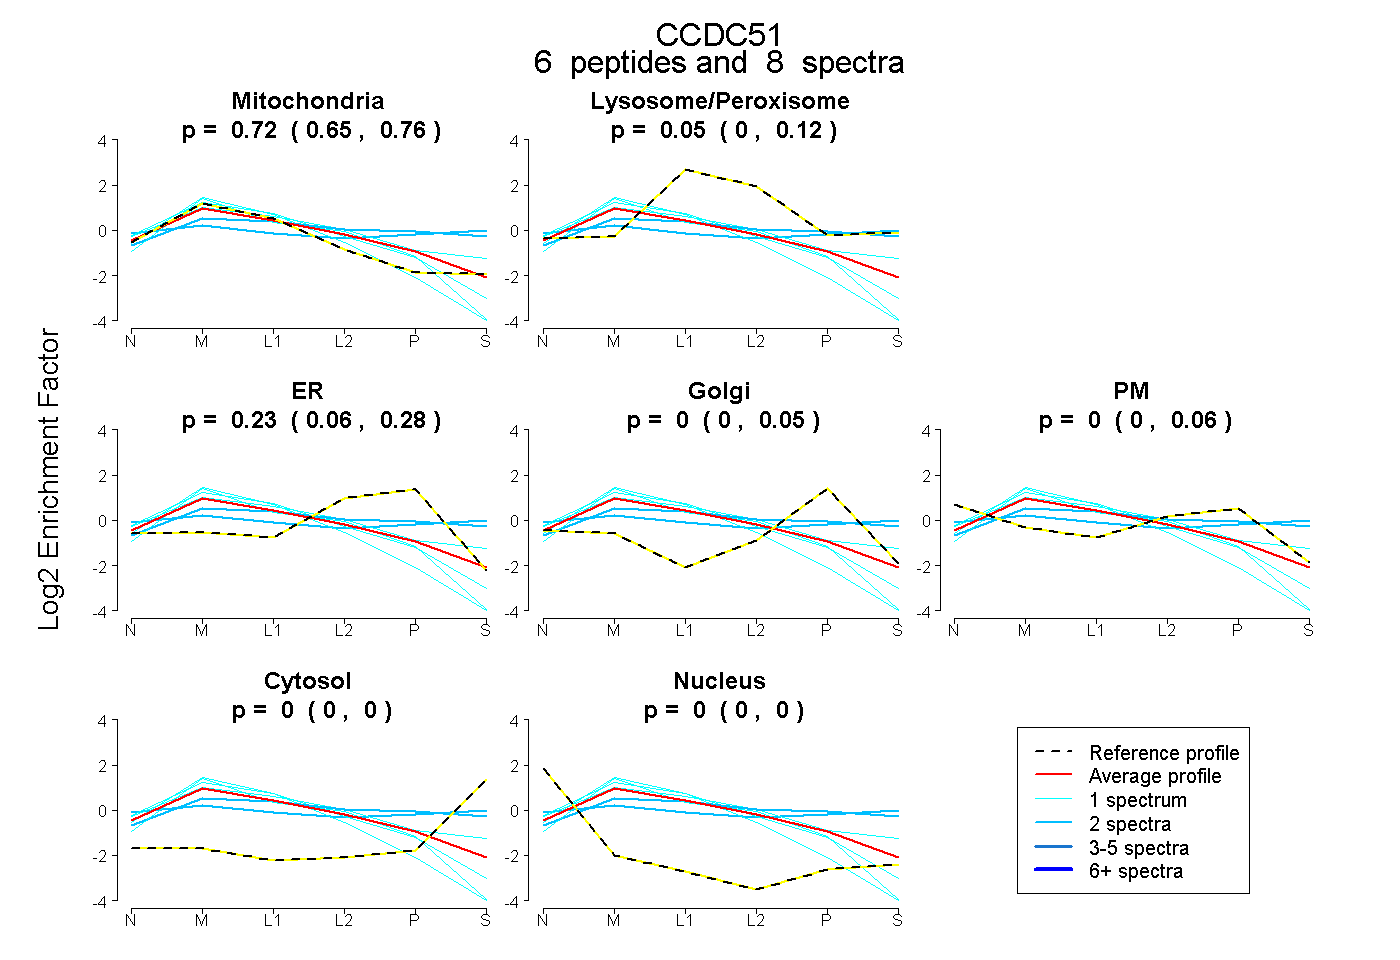
0.645 | 0.756
0.000 | 0.125
0.063 | 0.278
0.000 | 0.046
0.000 | 0.062
0.000 | 0.000
0.000 | 0.000
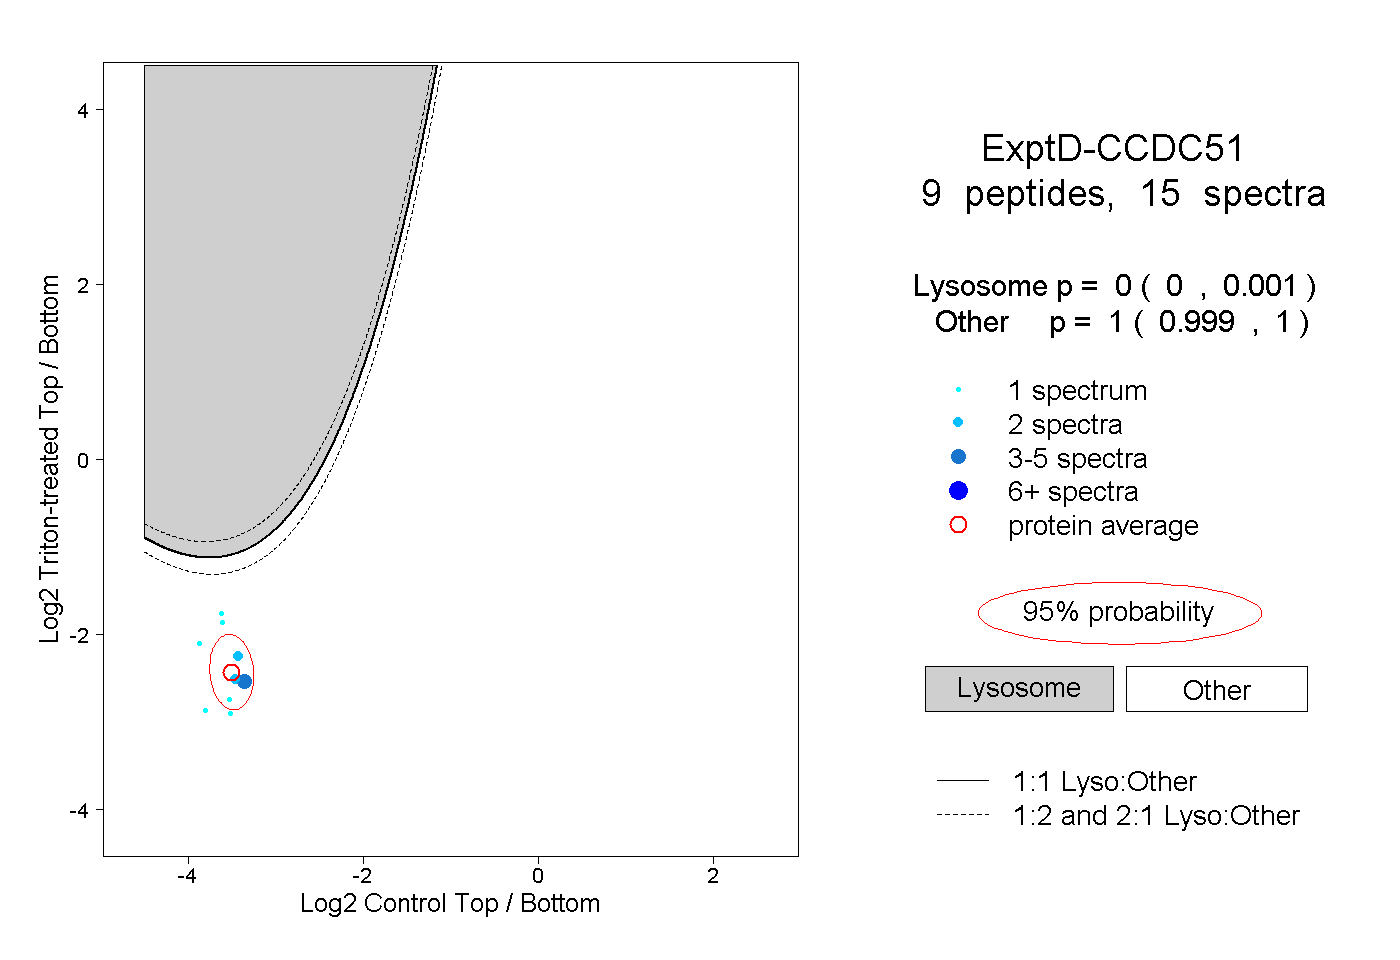
20peptides
spectra
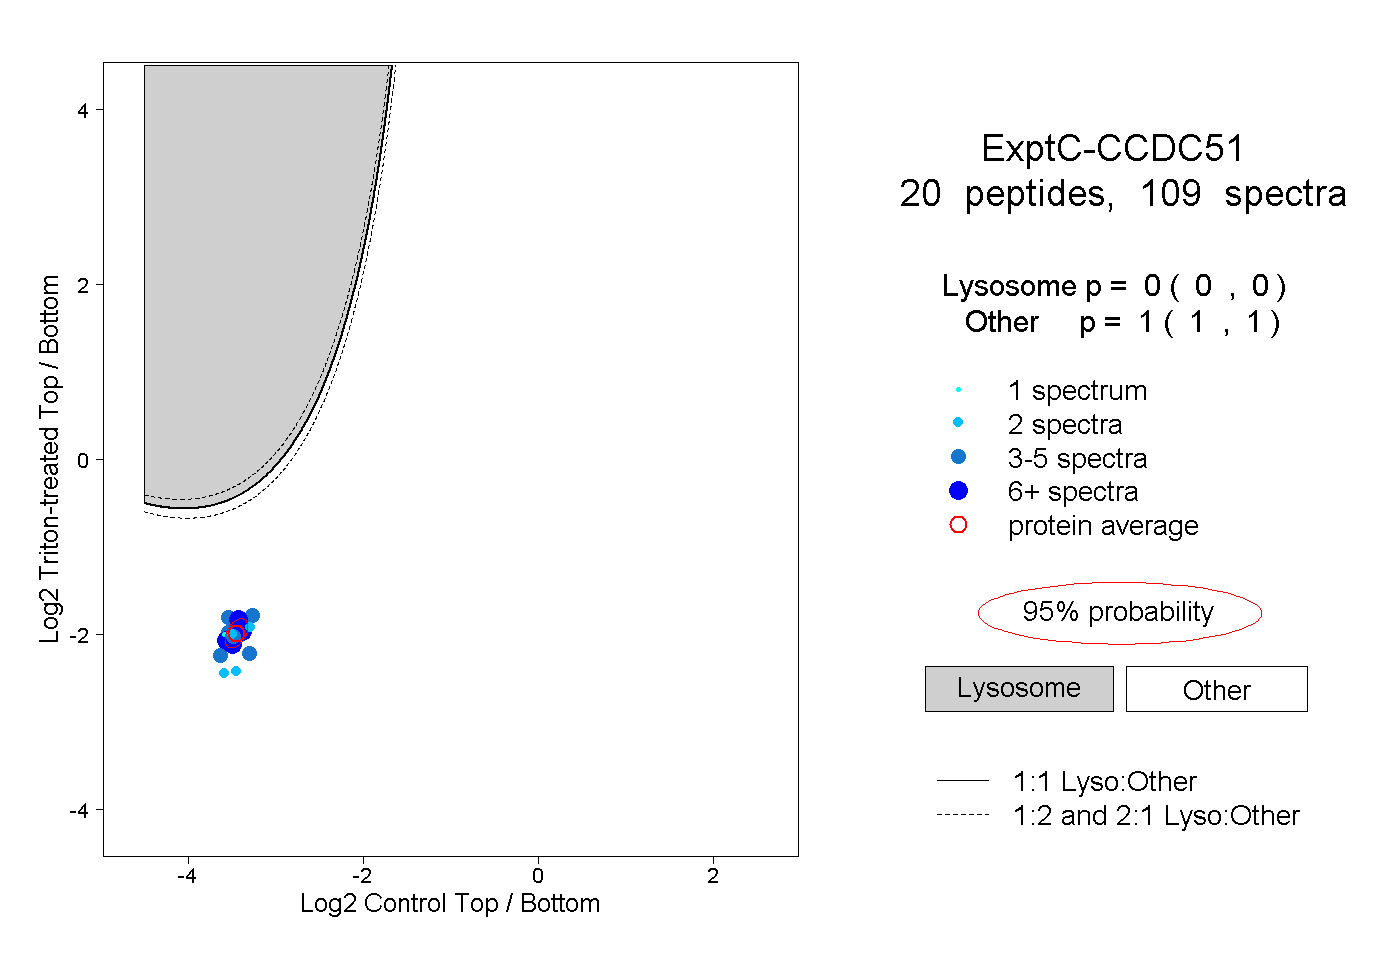
0.000 | 0.000
1.000 | 1.000