PBXIP1
[ENSRNOP00000028058]
Main page
| | | Plot |
Mito |
Lyso |
|
Perox |
ER |
Golgi |
PM |
Cytosol |
Nucleus |
|
| Expt A |
 14
14
peptides |
24
spectra |
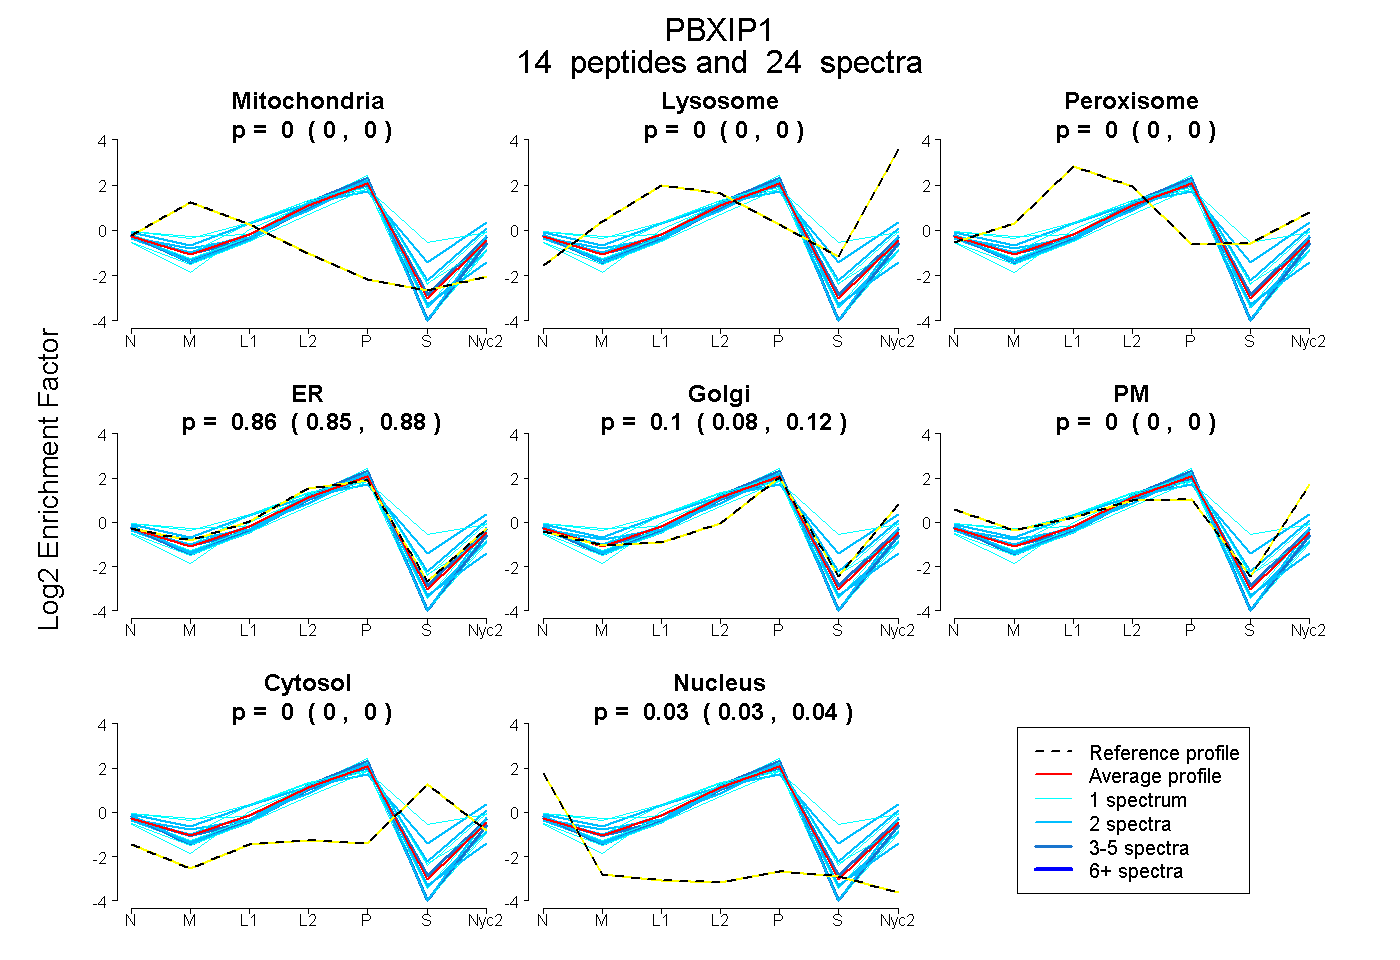 |
0.000
0.000 | 0.000 |
0.000
0.000 | 0.000 |
|
0.000
0.000 | 0.000 |
0.862
0.846 | 0.876 |
0.103
0.083 | 0.119 |
0.000
0.000 | 0.000 |
0.000
0.000 | 0.000 |
0.035
0.030 | 0.039 |
|
| | | Plot |
Mito |
|
Lyso or Perox |
|
ER |
Golgi |
PM |
Cytosol |
Nucleus |
|
| Expt B |
3
peptides |
3
spectra |
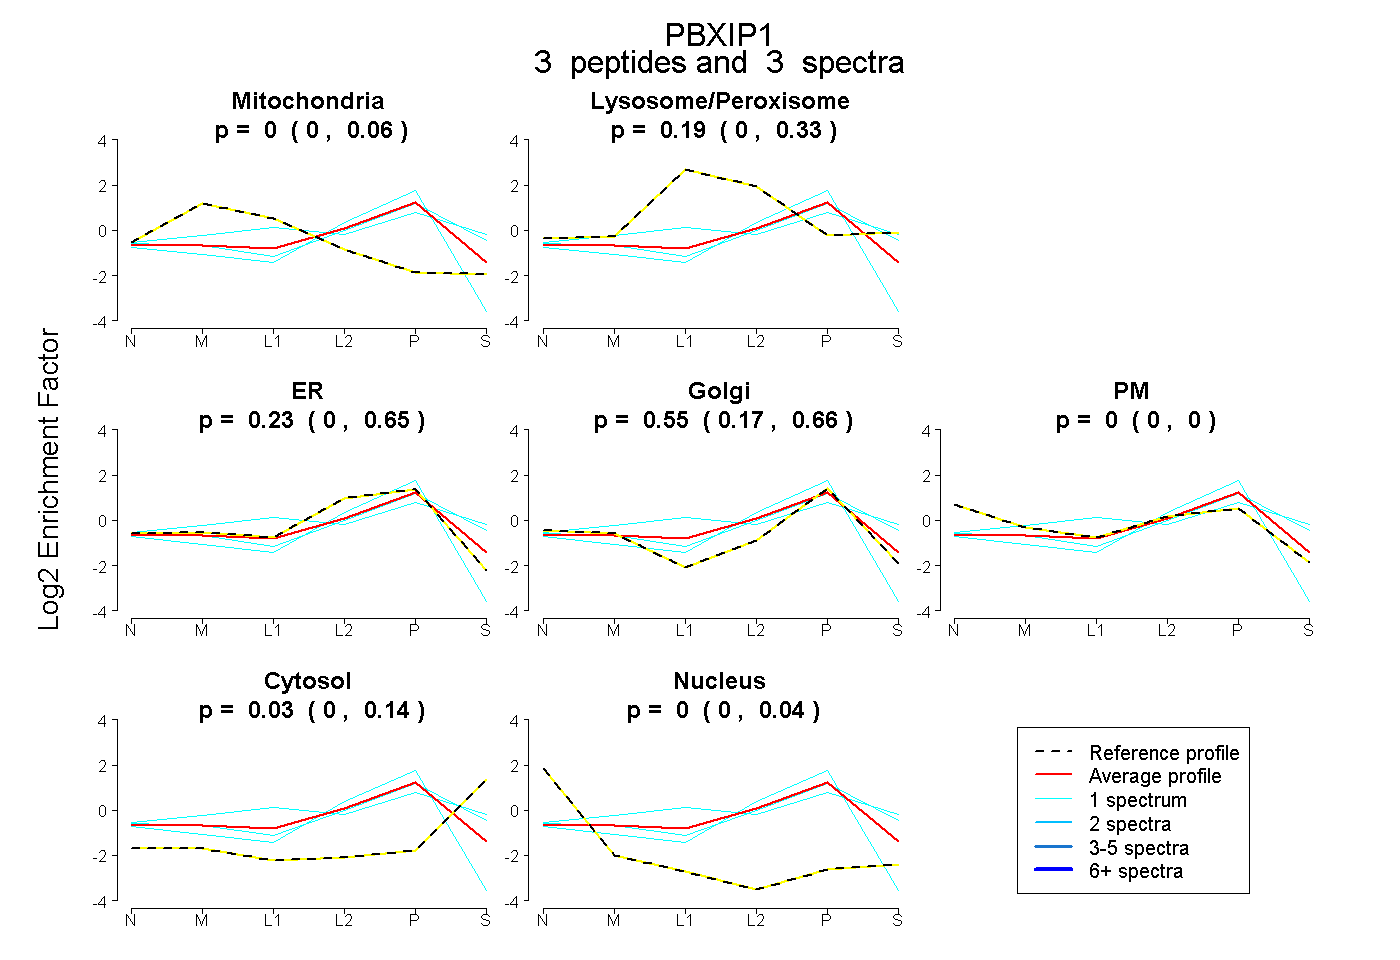 |
0.000
0.000 | 0.061 |
|
0.195
0.000 | 0.332 |
|
0.232
0.000 | 0.651 |
0.548
0.166 | 0.657 |
0.000
0.000 | 0.000 |
0.025
0.000 | 0.143 |
0.000
0.000 | 0.036 |
|
| 1 spectrum, LQGLEANCVR |
0.000 |
|
0.216 |
|
0.103 |
0.541 |
0.000 |
0.140 |
0.000 |
|
| 1 spectrum, QLEAEAK |
0.000 |
|
0.429 |
|
0.000 |
0.433 |
0.000 |
0.137 |
0.000 |
|
| 1 spectrum, GLEEENAR |
0.000 |
|
0.000 |
|
0.692 |
0.308 |
0.000 |
0.000 |
0.000 |
|
| | | Plot |
|
Lyso |
|
|
|
|
|
|
|
Other |
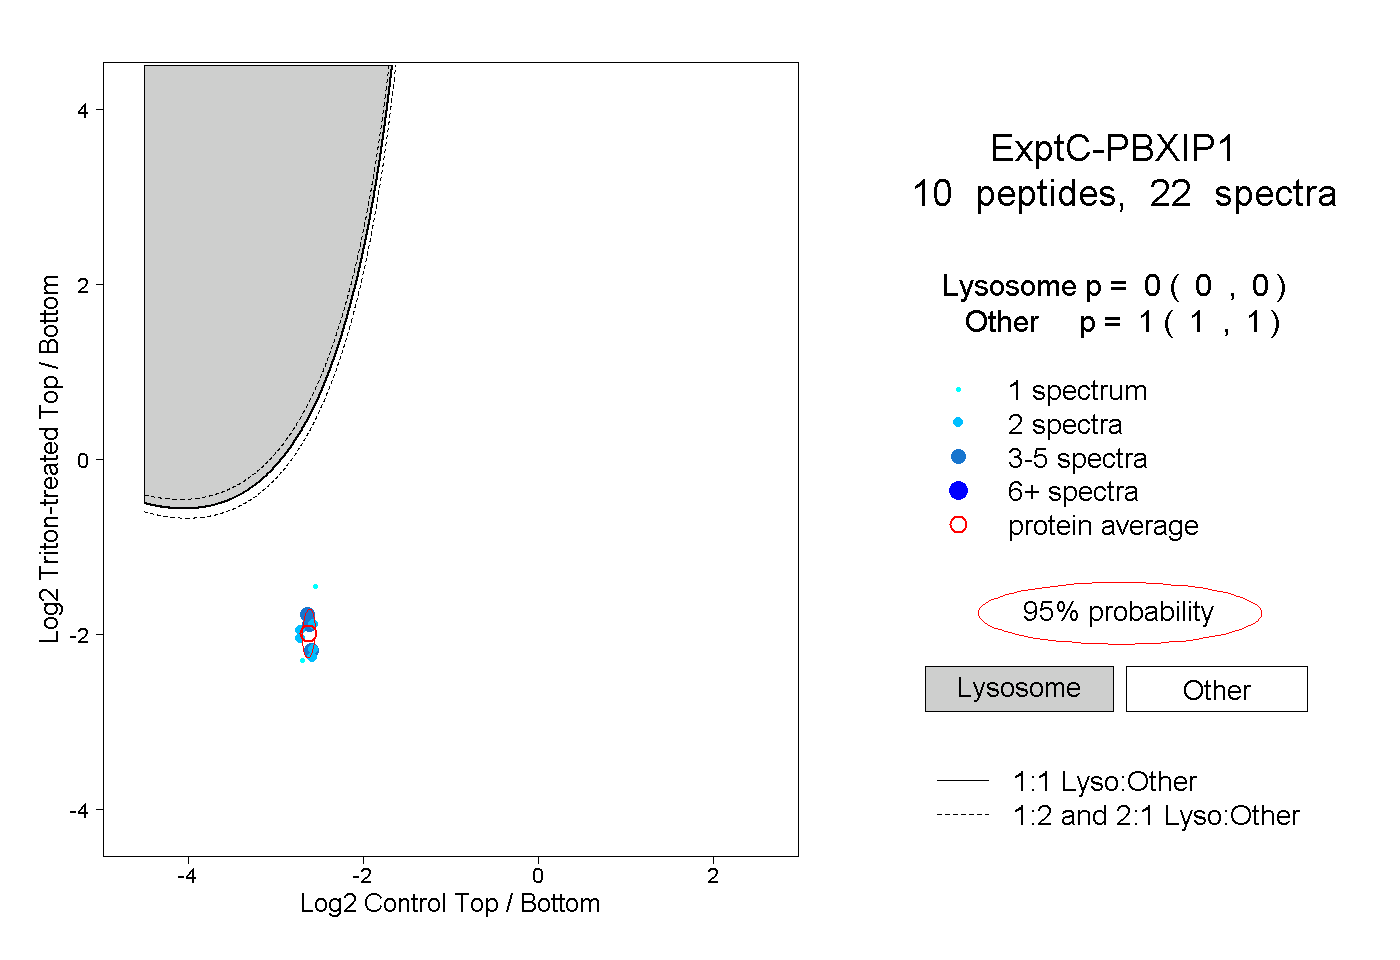
| Expt C |
10
peptides |
22
spectra |
 |
|
0.000
0.000 | 0.000 |
|
|
|
|
|
|
|
1.000
1.000 | 1.000 |
| | | Plot |
|
Lyso |
|
|
|
|
|
|
|
Other |
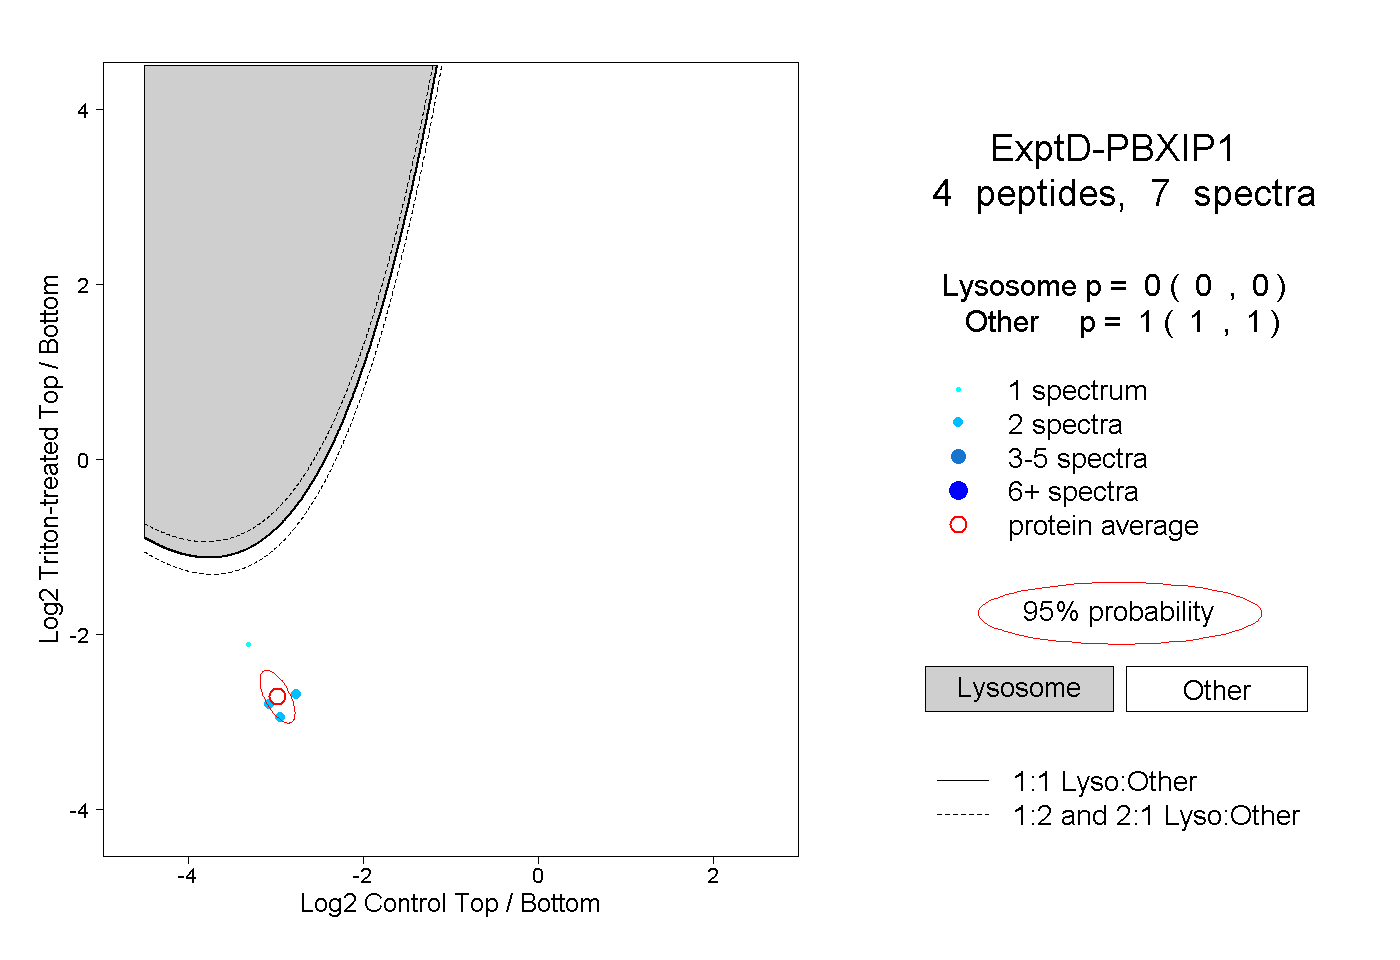
| Expt D |
4
peptides |
7
spectra |
 |
|
0.000
0.000 | 0.000 |
|
|
|
|
|
|
|
1.000
1.000 | 1.000 |