 14
14peptides
spectra
0.000 | 0.000
0.000 | 0.000
0.000 | 0.000
0.846 | 0.876
0.083 | 0.119
0.000 | 0.000
0.000 | 0.000
0.030 | 0.039
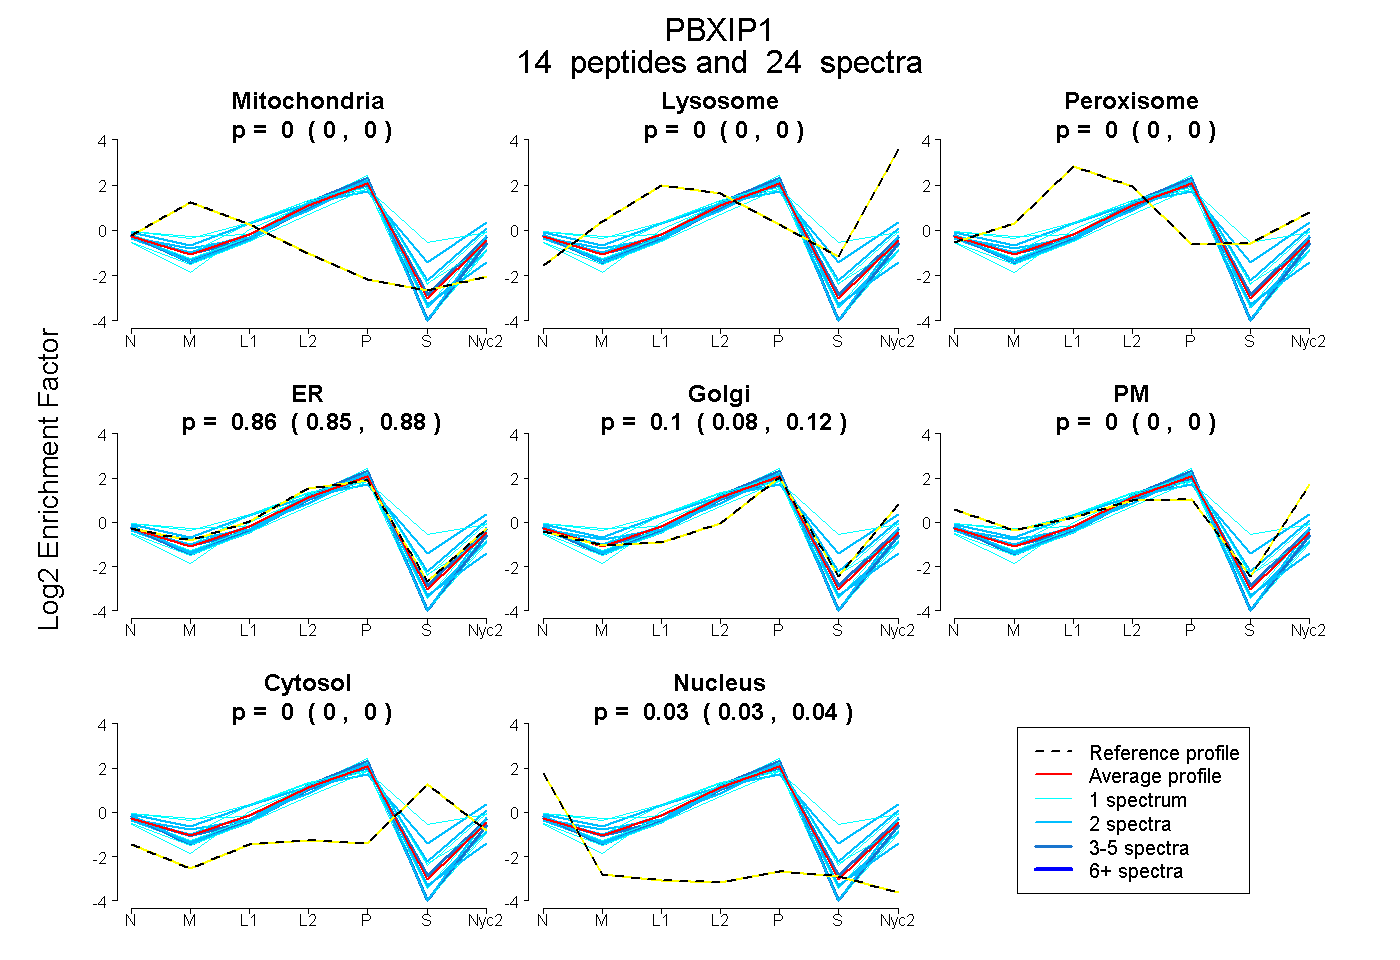
| Plot | Mito | Lyso | Perox | ER | Golgi | PM | Cytosol | Nucleus | |||||
| Expt A |
14 peptides |
24 spectra |
|
0.000 0.000 | 0.000 |
0.000 0.000 | 0.000 |
0.000 0.000 | 0.000 |
0.862 0.846 | 0.876 |
0.103 0.083 | 0.119 |
0.000 0.000 | 0.000 |
0.000 0.000 | 0.000 |
0.035 0.030 | 0.039 |
| 1 spectrum, GQEPDTSLLEQHK | 0.000 | 0.000 | 0.000 | 0.927 | 0.000 | 0.000 | 0.000 | 0.073 | ||
| 1 spectrum, ENQDIR | 0.000 | 0.000 | 0.000 | 0.927 | 0.000 | 0.000 | 0.033 | 0.039 | ||
| 2 spectra, YRPPQGCSGVADCAR | 0.000 | 0.000 | 0.000 | 0.902 | 0.000 | 0.000 | 0.000 | 0.098 | ||
| 1 spectrum, QEGLALFGVELAPVR | 0.064 | 0.000 | 0.000 | 0.855 | 0.048 | 0.034 | 0.000 | 0.000 | ||
| 4 spectra, GLEEENAR | 0.000 | 0.000 | 0.000 | 0.920 | 0.026 | 0.000 | 0.000 | 0.054 | ||
| 1 spectrum, ELPLSPAYFGEDGIFR | 0.000 | 0.000 | 0.000 | 0.956 | 0.000 | 0.000 | 0.000 | 0.044 | ||
| 1 spectrum, TSHQALESELQQLR | 0.000 | 0.007 | 0.043 | 0.827 | 0.122 | 0.000 | 0.000 | 0.000 | ||
| 2 spectra, LQGLEANCVR | 0.000 | 0.000 | 0.000 | 0.623 | 0.332 | 0.000 | 0.045 | 0.000 | ||
| 3 spectra, ATTEQGHK | 0.000 | 0.000 | 0.000 | 0.749 | 0.213 | 0.000 | 0.000 | 0.038 | ||
| 2 spectra, QQELASVLR | 0.000 | 0.000 | 0.000 | 0.835 | 0.154 | 0.000 | 0.000 | 0.011 | ||
| 2 spectra, NIHPQNLPSSPR | 0.000 | 0.000 | 0.223 | 0.424 | 0.296 | 0.025 | 0.032 | 0.000 | ||
| 1 spectrum, EFTGHWK | 0.058 | 0.000 | 0.000 | 0.942 | 0.000 | 0.000 | 0.000 | 0.000 | ||
| 2 spectra, DNSPDSVSWEELLR | 0.000 | 0.000 | 0.000 | 0.929 | 0.005 | 0.000 | 0.000 | 0.067 | ||
| 1 spectrum, QLEAEAK | 0.000 | 0.016 | 0.000 | 0.525 | 0.172 | 0.000 | 0.288 | 0.000 |
| Plot | Mito | Lyso or Perox | ER | Golgi | PM | Cytosol | Nucleus | ||||||
| Expt B |
3 peptides |
3 spectra |
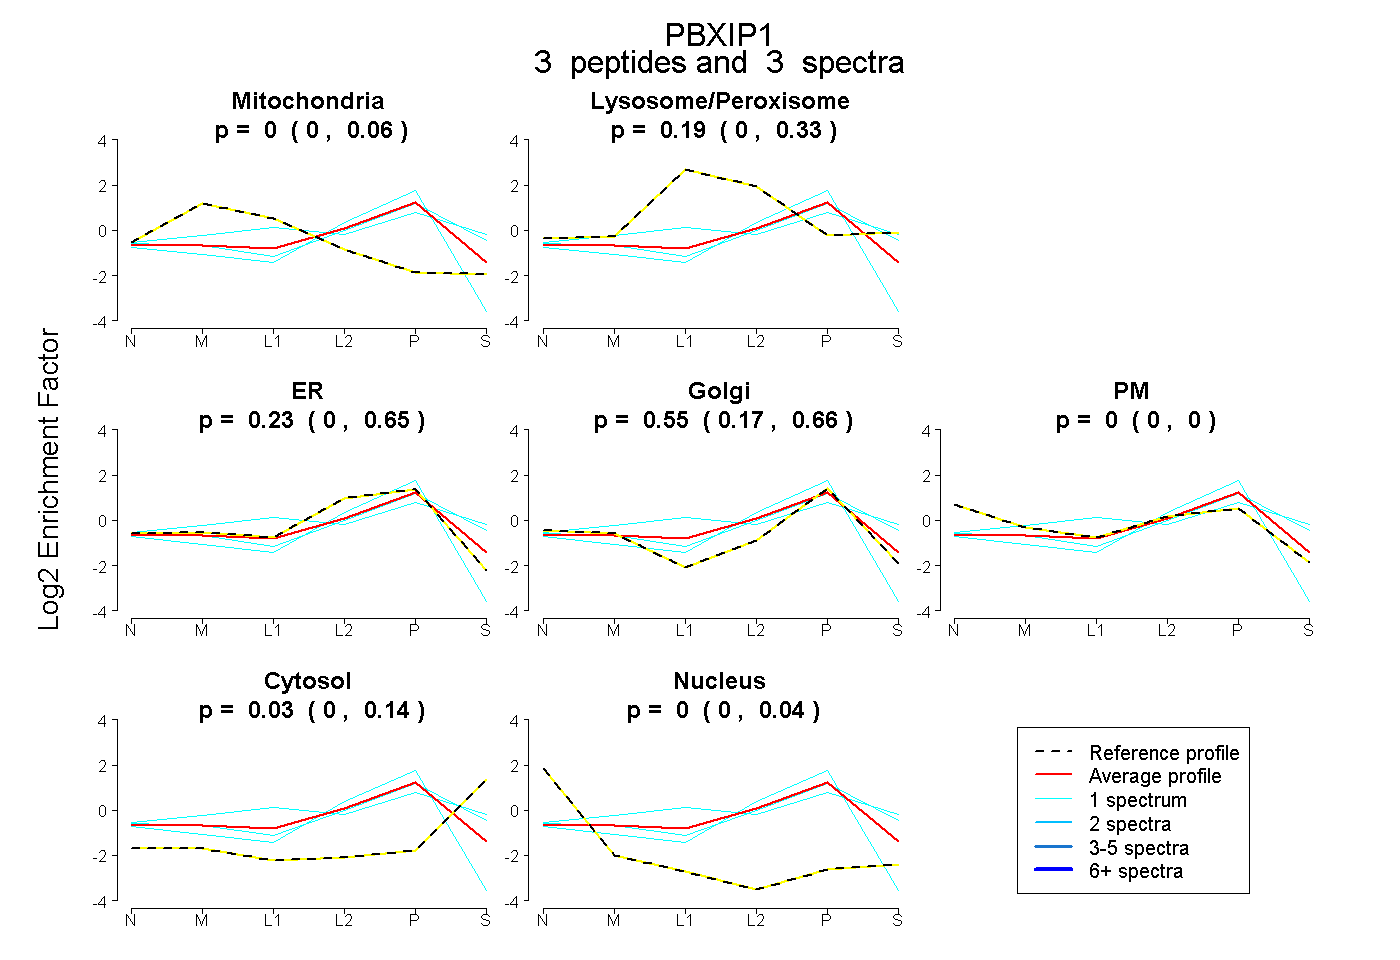 |
0.000 0.000 | 0.061 |
0.195 0.000 | 0.332 |
0.232 0.000 | 0.651 |
0.548 0.166 | 0.657 |
0.000 0.000 | 0.000 |
0.025 0.000 | 0.143 |
0.000 0.000 | 0.036 |
|||
| Plot | Lyso | Other | |||||||||||
| Expt C |
10 peptides |
22 spectra |
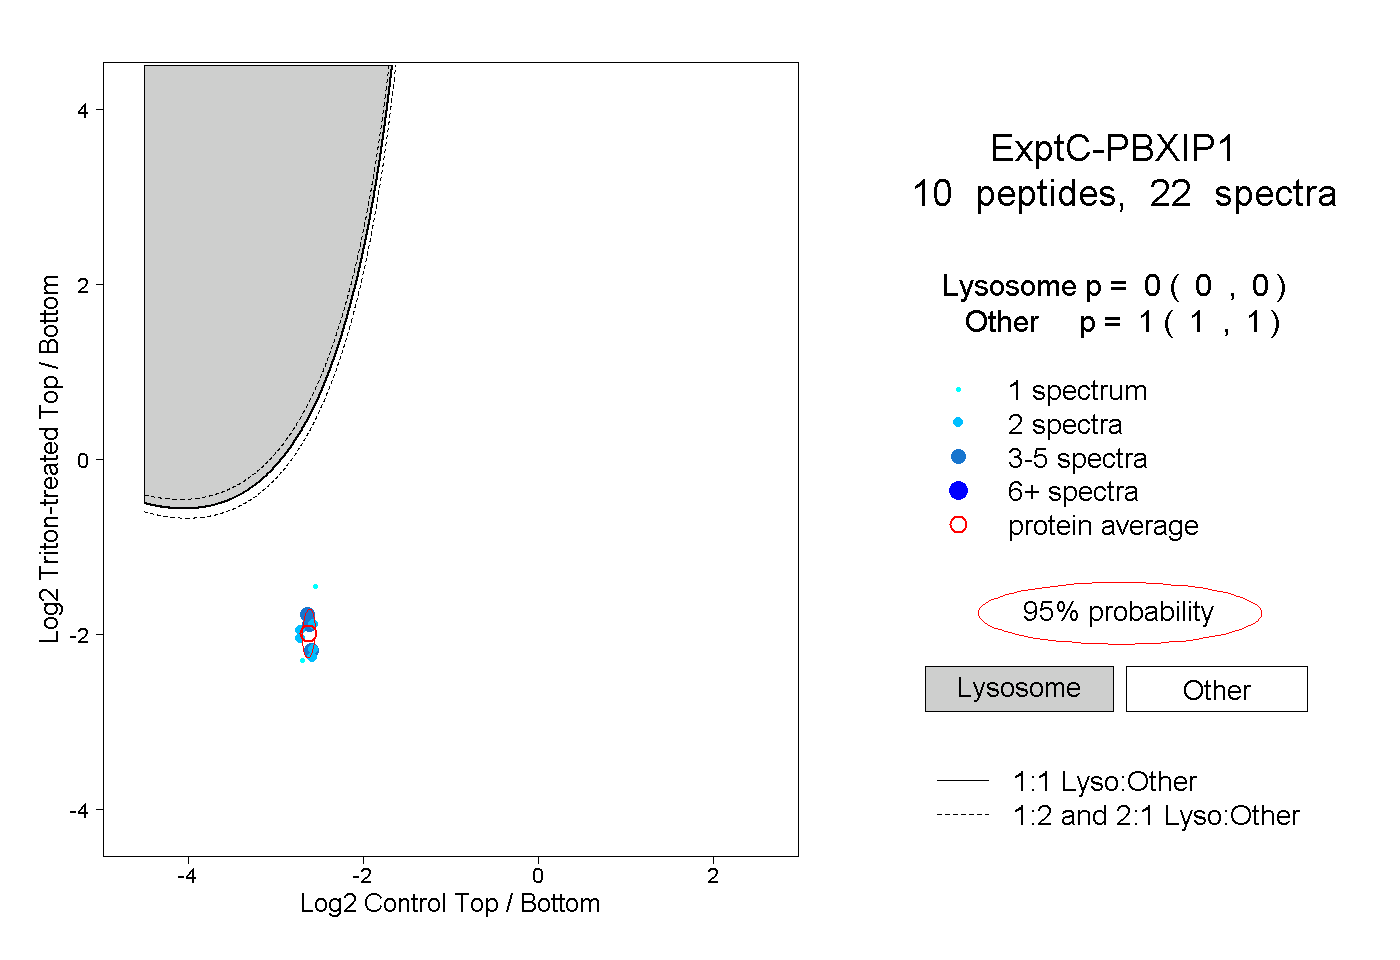 |
0.000 0.000 | 0.000 |
1.000 1.000 | 1.000 |
||||||||
| Plot | Lyso | Other | |||||||||||
| Expt D |
4 peptides |
7 spectra |
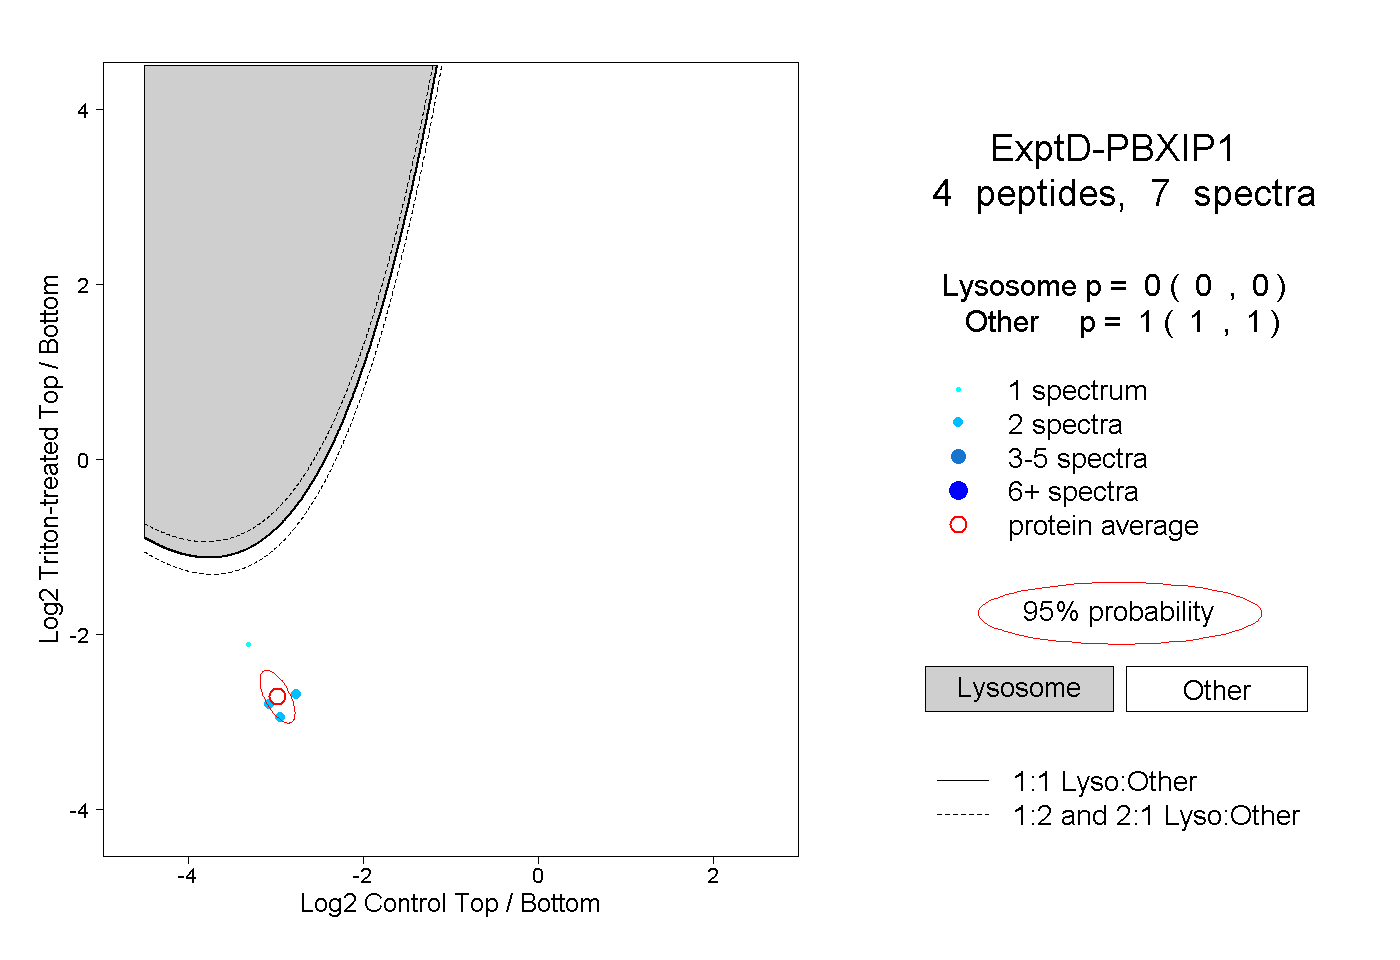 |
0.000 0.000 | 0.000 |
1.000 1.000 | 1.000 |