AARSD1
[ENSRNOP00000028047]
Main page
| | | Plot |
Mito |
Lyso |
|
Perox |
ER |
Golgi |
PM |
Cytosol |
Nucleus |
|
| Expt A |
 8
8
peptides |
16
spectra |
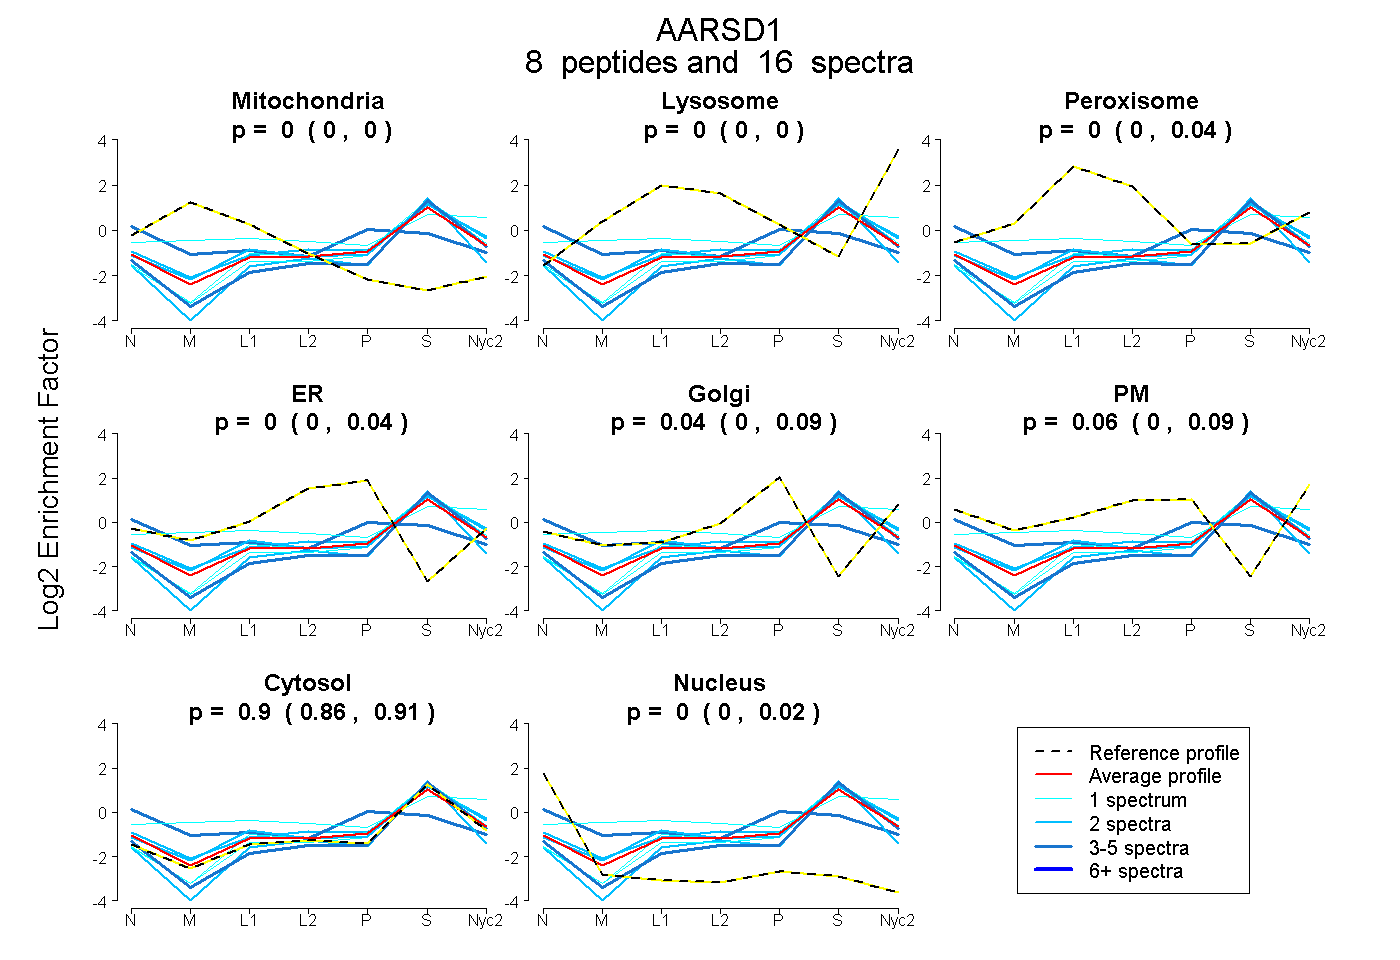 |
0.000
0.000 | 0.000 |
0.000
0.000 | 0.000 |
|
0.004
0.000 | 0.040 |
0.000
0.000 | 0.042 |
0.037
0.000 | 0.085 |
0.062
0.000 | 0.095 |
0.897
0.865 | 0.911 |
0.001
0.000 | 0.018 |
|
| | | Plot |
Mito |
|
Lyso or Perox |
|
ER |
Golgi |
PM |
Cytosol |
Nucleus |
|
| Expt B |
3
peptides |
7
spectra |
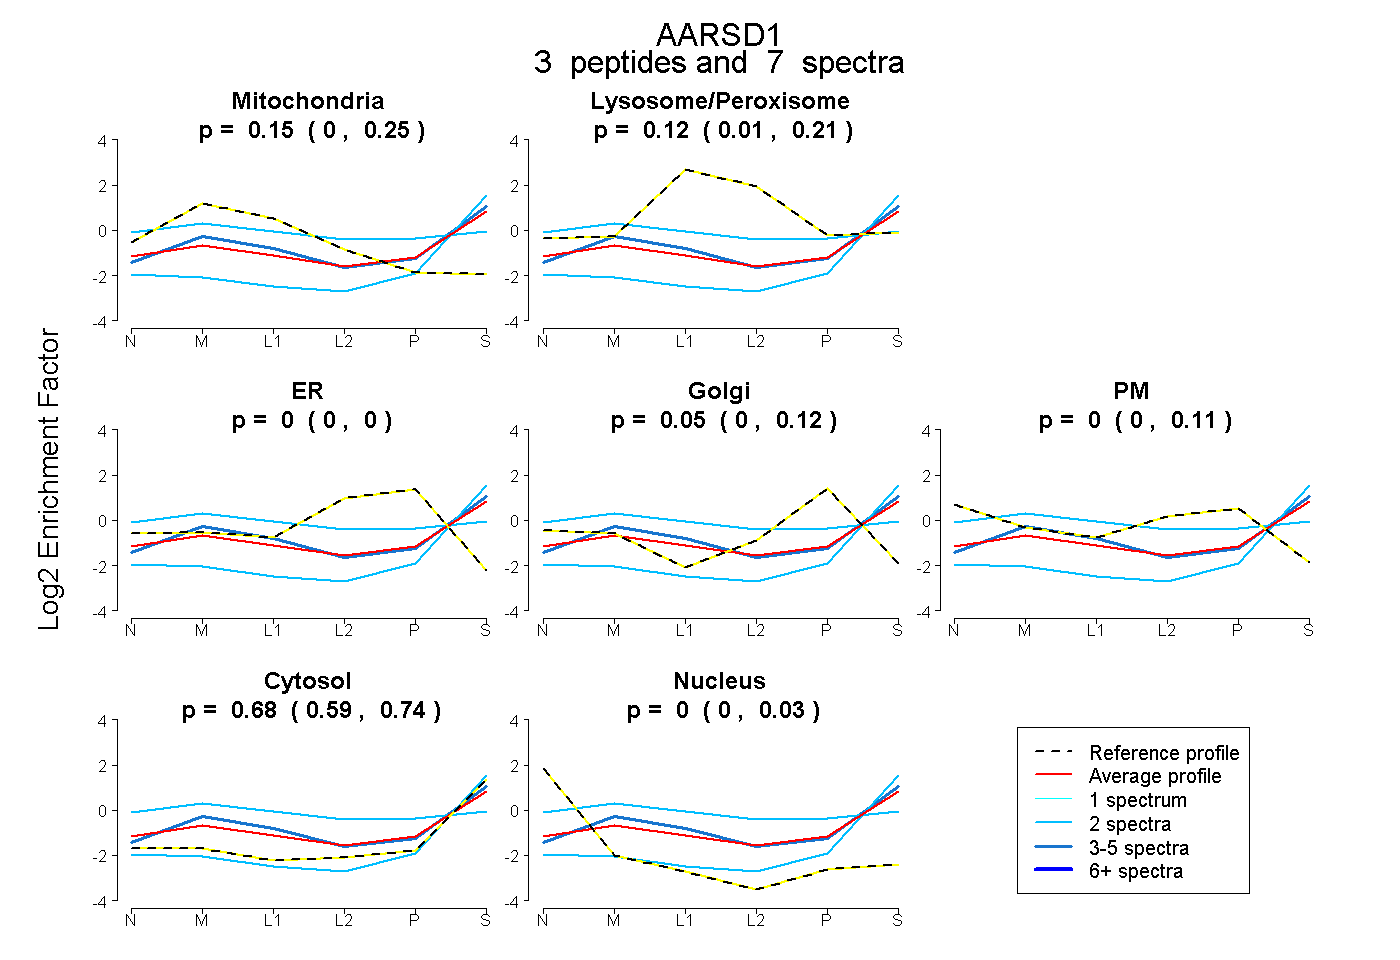 |
0.148
0.000 | 0.250 |
|
0.124
0.013 | 0.209 |
|
0.000
0.000 | 0.000 |
0.052
0.000 | 0.124 |
0.000
0.000 | 0.114 |
0.676
0.590 | 0.741 |
0.000
0.000 | 0.031 |
|
| 2 spectra, GTINDISVLR |
0.000 |
|
0.000 |
|
0.000 |
0.000 |
0.000 |
1.000 |
0.000 |
|
| 2 spectra, SNLIFLAGNR |
0.195 |
|
0.248 |
|
0.000 |
0.012 |
0.290 |
0.254 |
0.000 |
|
| 3 spectra, DLAVHTAHTLR |
0.200 |
|
0.136 |
|
0.000 |
0.000 |
0.000 |
0.664 |
0.000 |
|
| | | Plot |
|
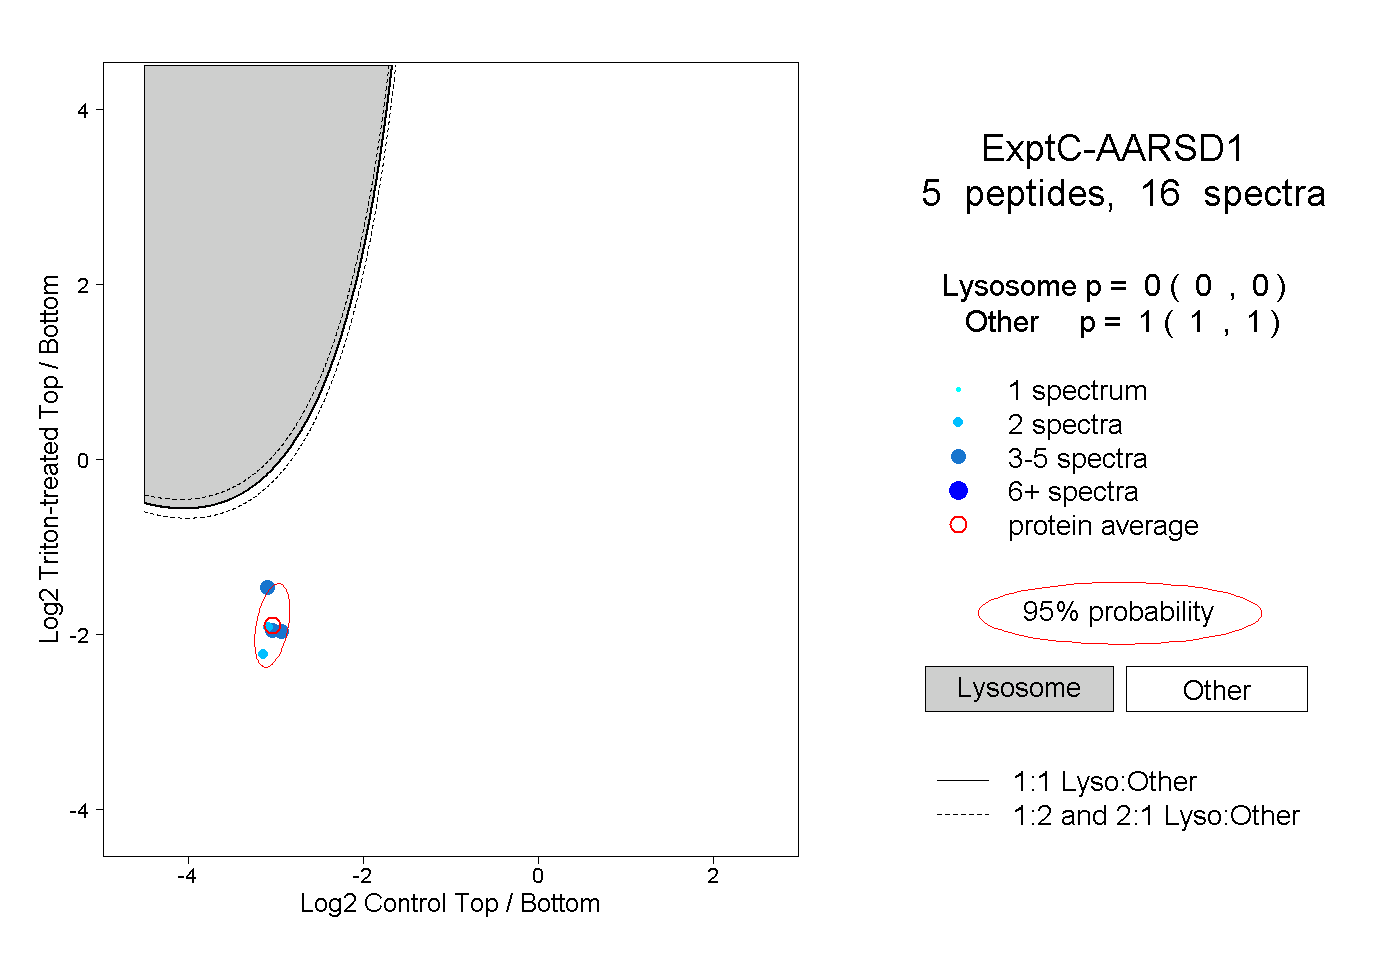
Lyso |
|
|
|
|
|
|
|
Other |
| Expt C |
5
peptides |
16
spectra |
 |
|
0.000
0.000 | 0.000 |
|
|
|
|
|
|
|
1.000
1.000 | 1.000 |
| | | Plot |
|
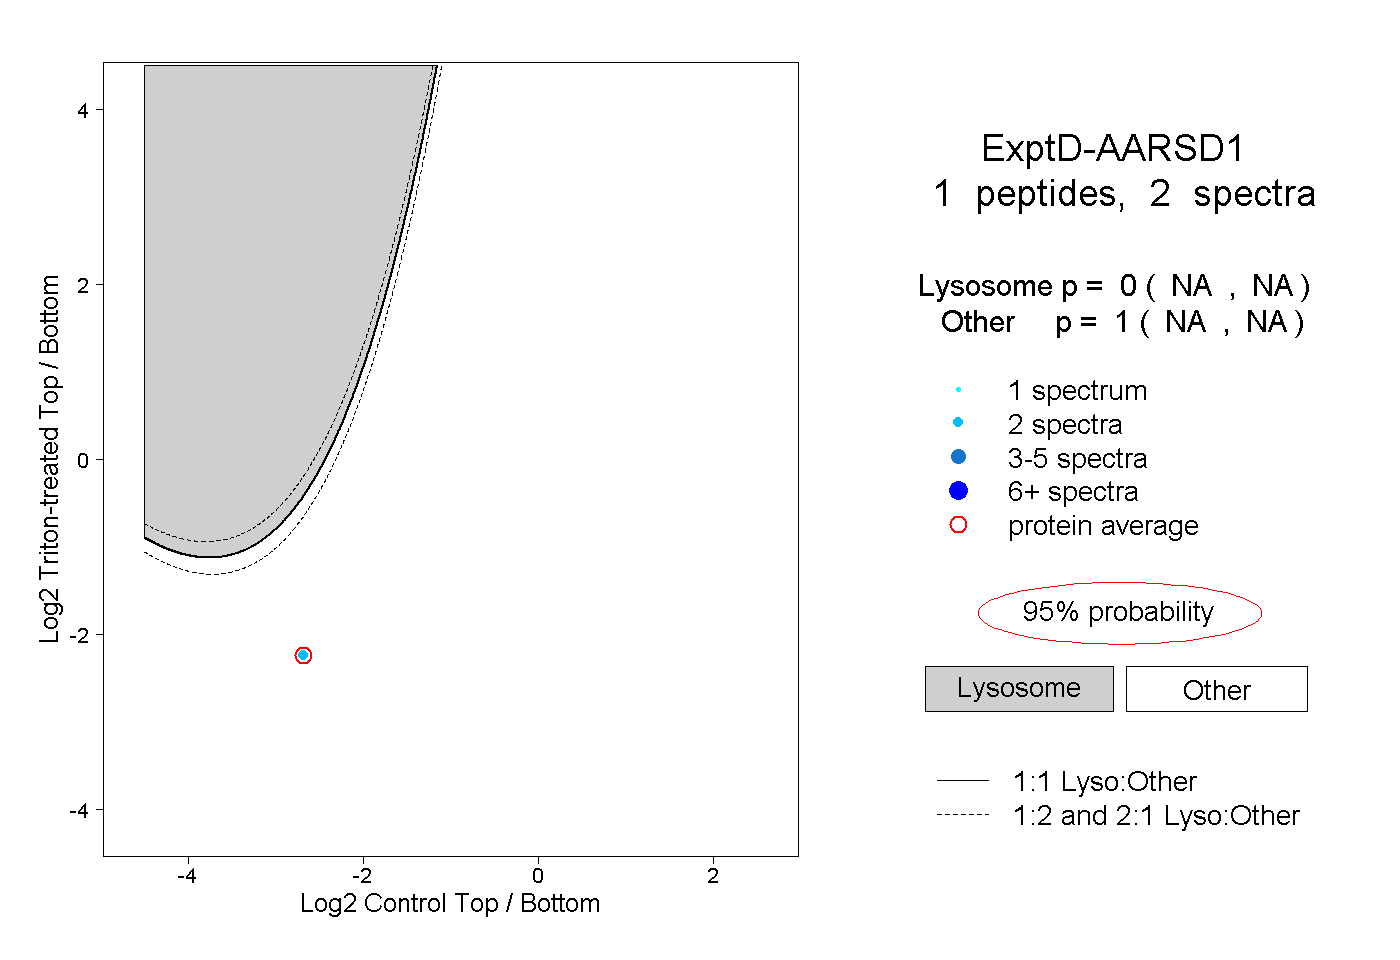
Lyso |
|
|
|
|
|
|
|
Other |
| Expt D |
1
peptide |
2
spectra |
 |
|
0.000
NA | NA |
|
|
|
|
|
|
|
1.000
NA | NA |