 4
4peptides
spectra
0.000 | 0.000
0.000 | 0.000
0.000 | 0.000
0.000 | 0.000
0.001 | 0.056
0.000 | 0.000
0.862 | 0.895
0.056 | 0.115
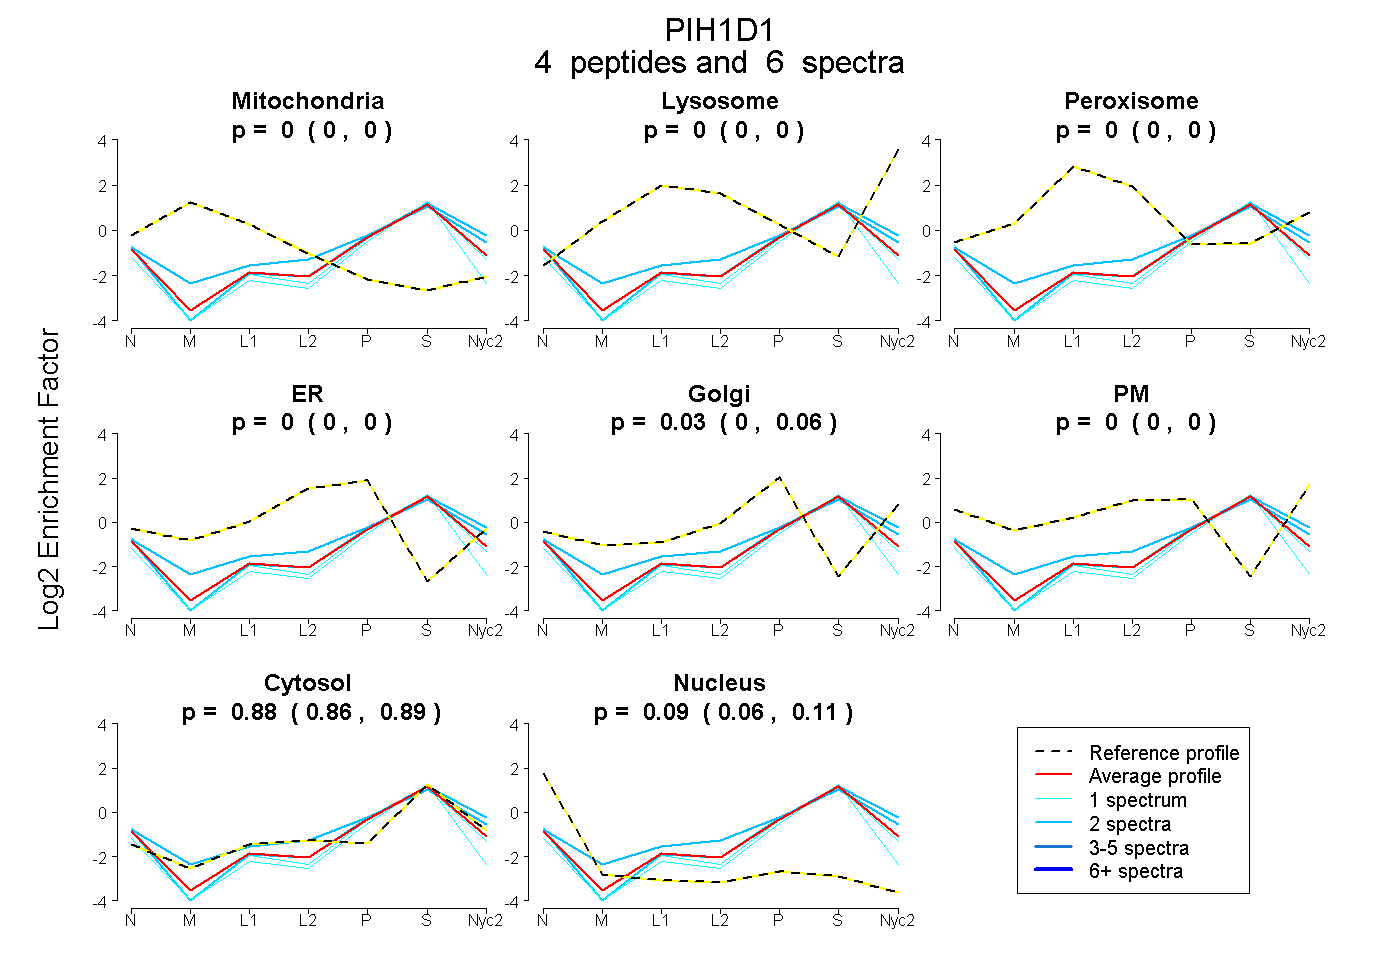
| Plot | Mito | Lyso | Perox | ER | Golgi | PM | Cytosol | Nucleus | |||||
| Expt A |
4 peptides |
6 spectra |
|
0.000 0.000 | 0.000 |
0.000 0.000 | 0.000 |
0.000 0.000 | 0.000 |
0.000 0.000 | 0.000 |
0.031 0.001 | 0.056 |
0.000 0.000 | 0.000 |
0.881 0.862 | 0.895 |
0.089 0.056 | 0.115 |
| 1 spectrum, LVVGGPQQLYHLDACIPLR | 0.000 | 0.000 | 0.000 | 0.000 | 0.000 | 0.000 | 0.818 | 0.182 | ||
| 1 spectrum, SFLGSISQQSIR | 0.000 | 0.000 | 0.000 | 0.000 | 0.000 | 0.000 | 0.864 | 0.136 | ||
| 2 spectra, YGLQLNPEWR | 0.000 | 0.000 | 0.000 | 0.000 | 0.183 | 0.000 | 0.817 | 0.000 | ||
| 2 spectra, ELVVTIAR | 0.000 | 0.000 | 0.000 | 0.000 | 0.068 | 0.000 | 0.900 | 0.032 |