 2
2peptides
spectra
NA | NA
NA | NA
NA | NA
NA | NA
NA | NA
NA | NA
NA | NA
NA | NA
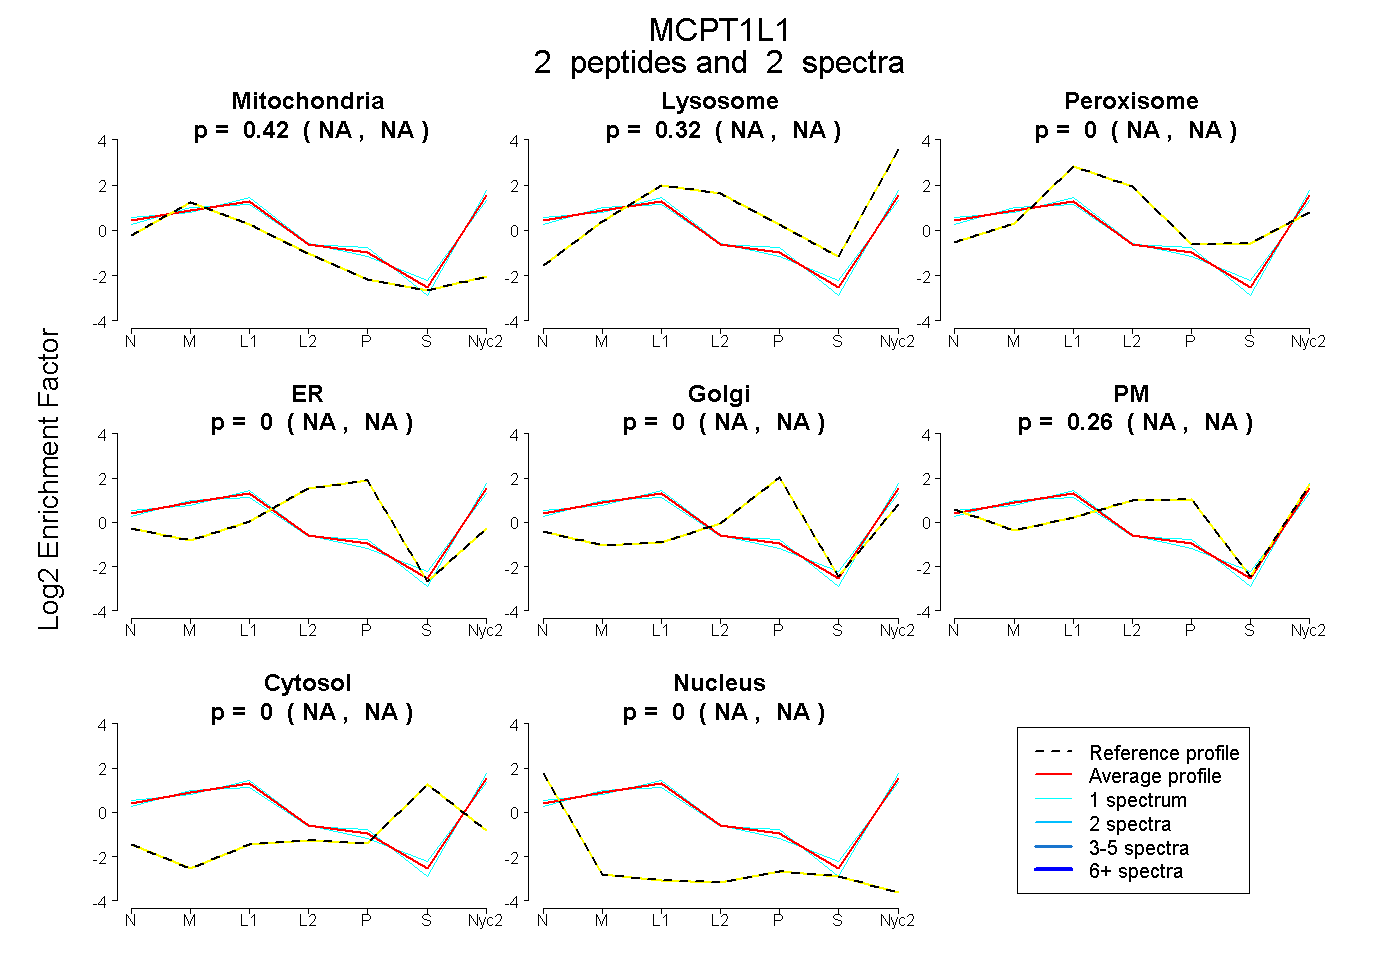
| Plot | Mito | Lyso | Perox | ER | Golgi | PM | Cytosol | Nucleus | |||||
| Expt A |
2 peptides |
2 spectra |
|
0.423 NA | NA |
0.319 NA | NA |
0.000 NA | NA |
0.000 NA | NA |
0.000 NA | NA |
0.258 NA | NA |
0.000 NA | NA |
0.000 NA | NA |
| 1 spectrum, ISPYVPWINK | 0.386 | 0.303 | 0.000 | 0.000 | 0.000 | 0.311 | 0.000 | 0.000 | ||
| 1 spectrum, ATCGGFLVTR | 0.441 | 0.357 | 0.000 | 0.000 | 0.000 | 0.182 | 0.000 | 0.019 |
| Plot | Mito | Lyso or Perox | ER | Golgi | PM | Cytosol | Nucleus | ||||||
| Expt B |
1 peptide |
1 spectrum |
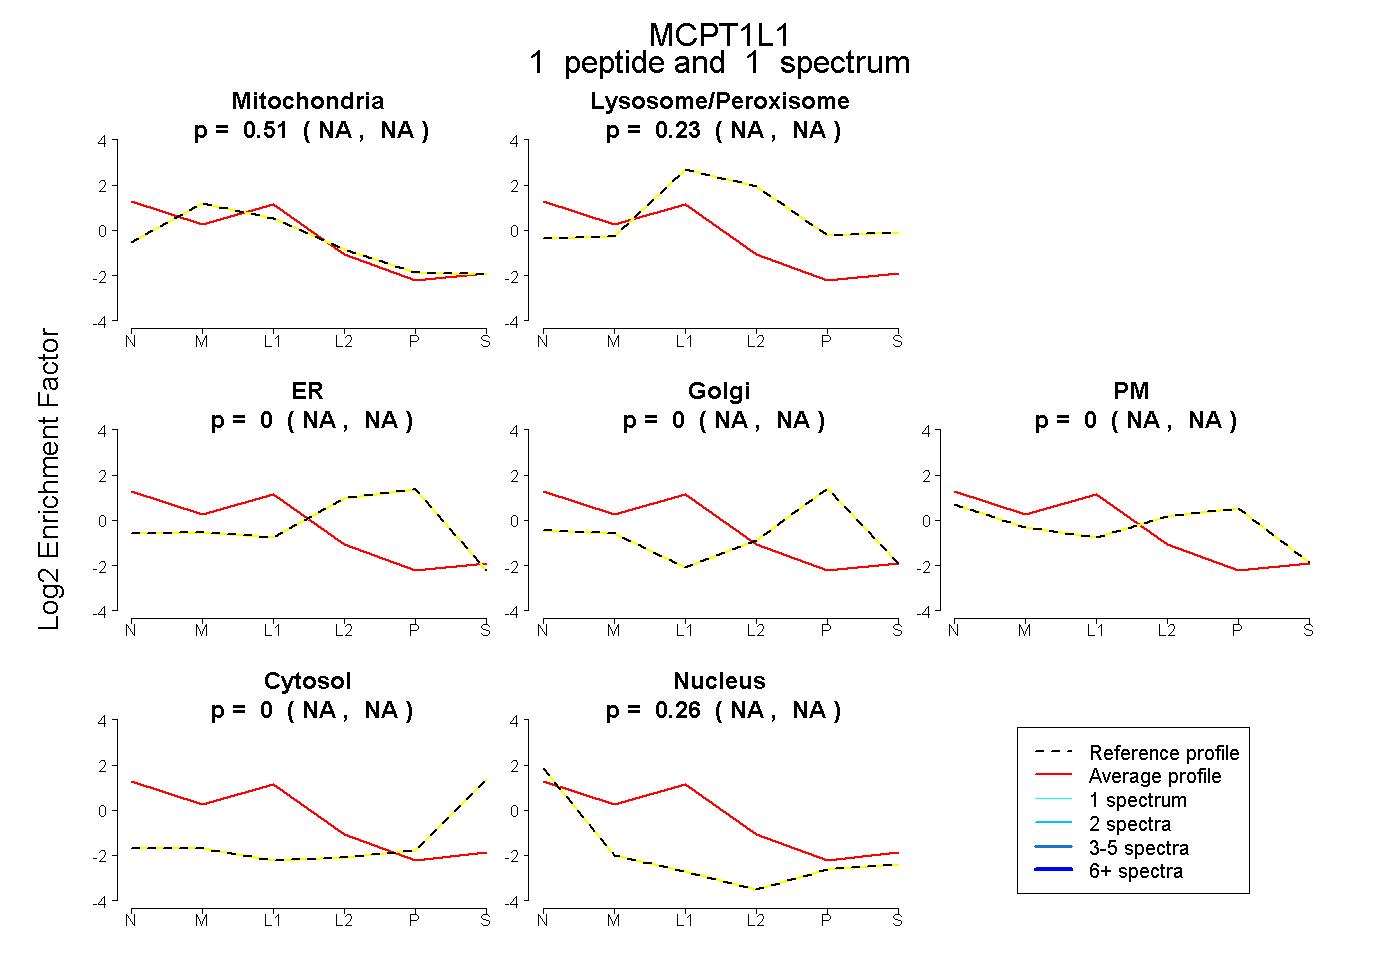 |
0.515 NA | NA |
0.228 NA | NA |
0.000 NA | NA |
0.000 NA | NA |
0.000 NA | NA |
0.000 NA | NA |
0.257 NA | NA |
|||
| Plot | Lyso | Other | |||||||||||
| Expt C |
4 peptides |
16 spectra |
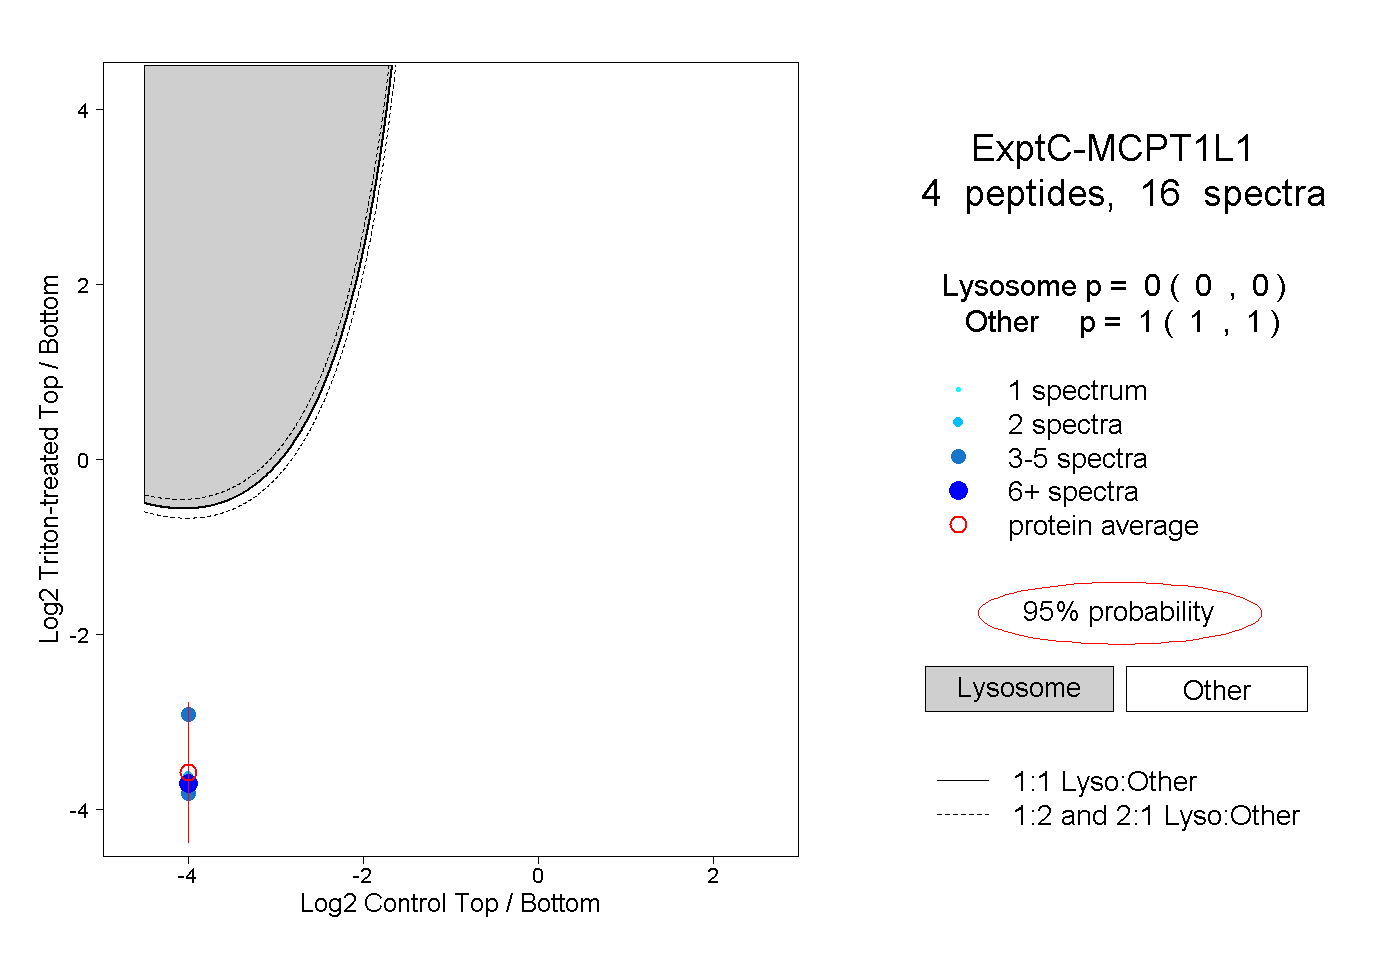 |
0.000 0.000 | 0.000 |
1.000 1.000 | 1.000 |
||||||||
| Plot | Lyso | Other | |||||||||||
| Expt D |
1 peptide |
1 spectrum |
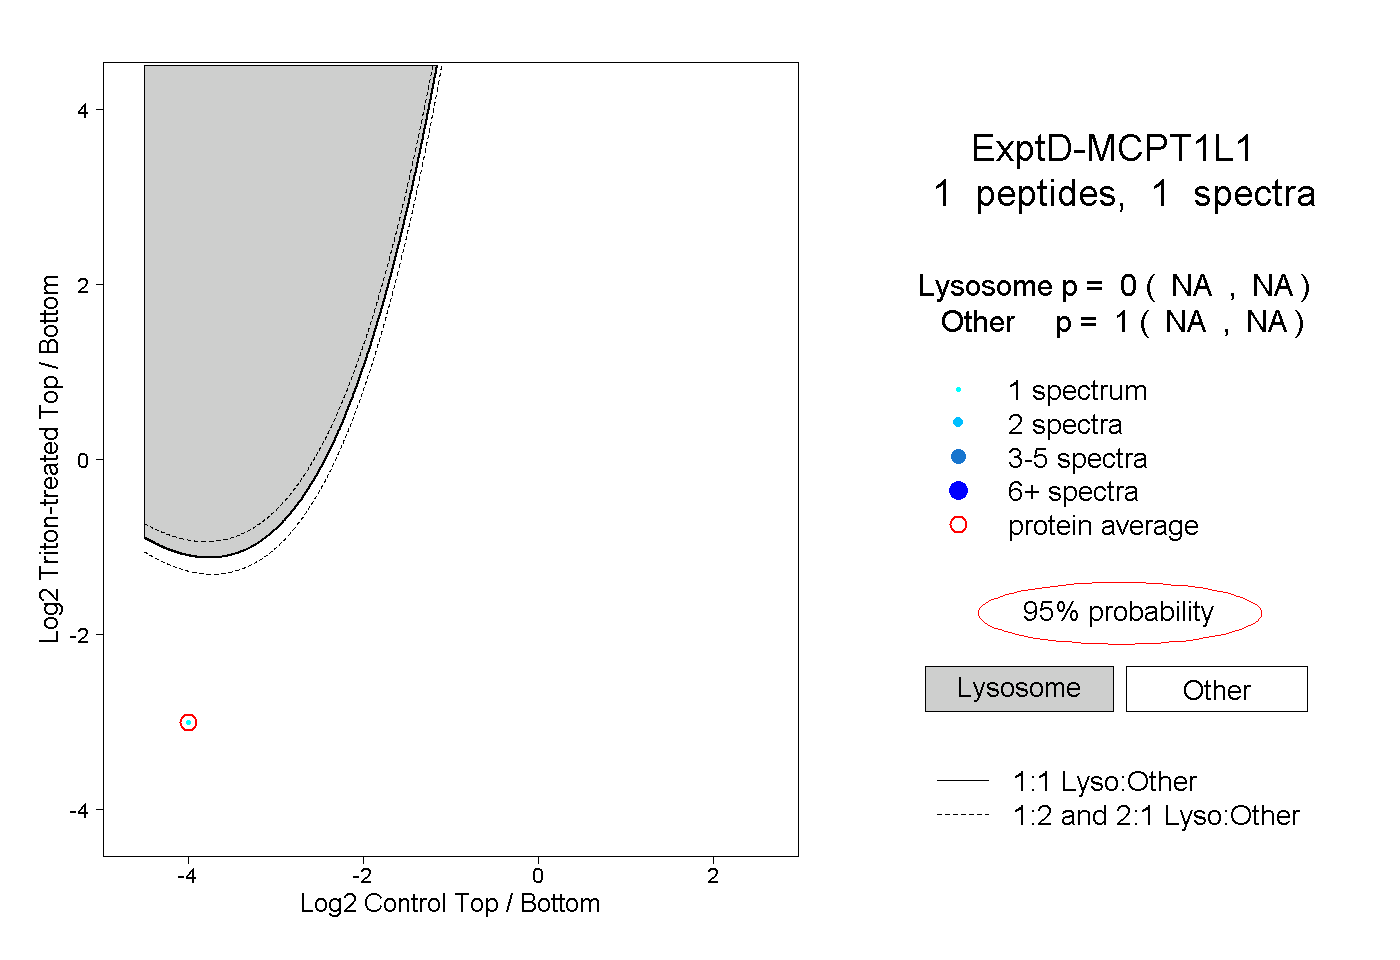 |
0.000 NA | NA |
1.000 NA | NA |