16
16peptides
spectra
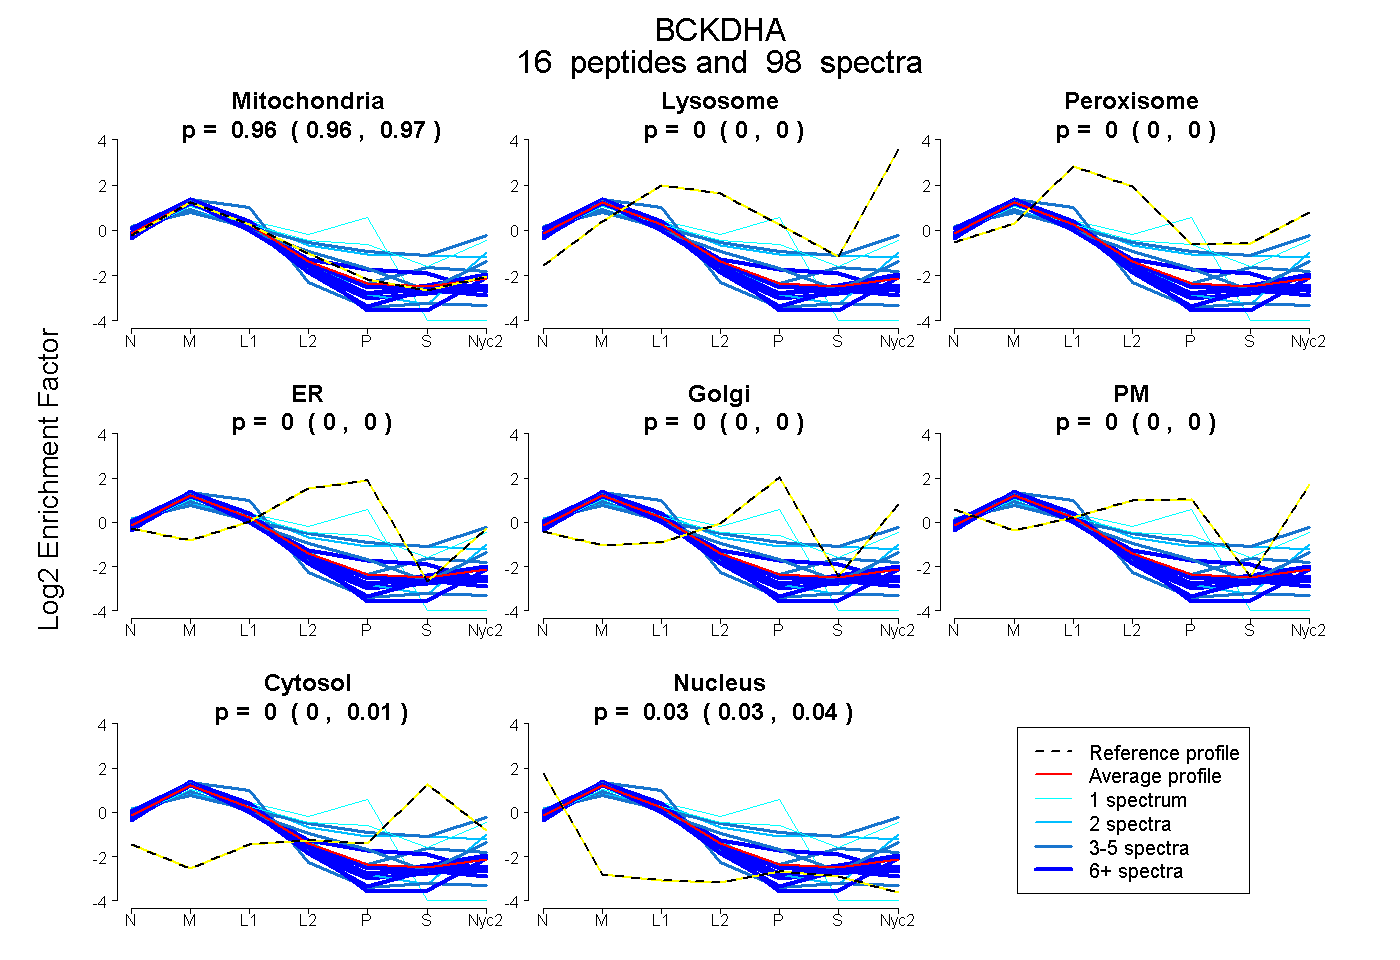
0.960 | 0.966
0.000 | 0.000
0.000 | 0.000
0.000 | 0.000
0.000 | 0.000
0.000 | 0.000
0.000 | 0.007
0.030 | 0.037
10peptides
spectra
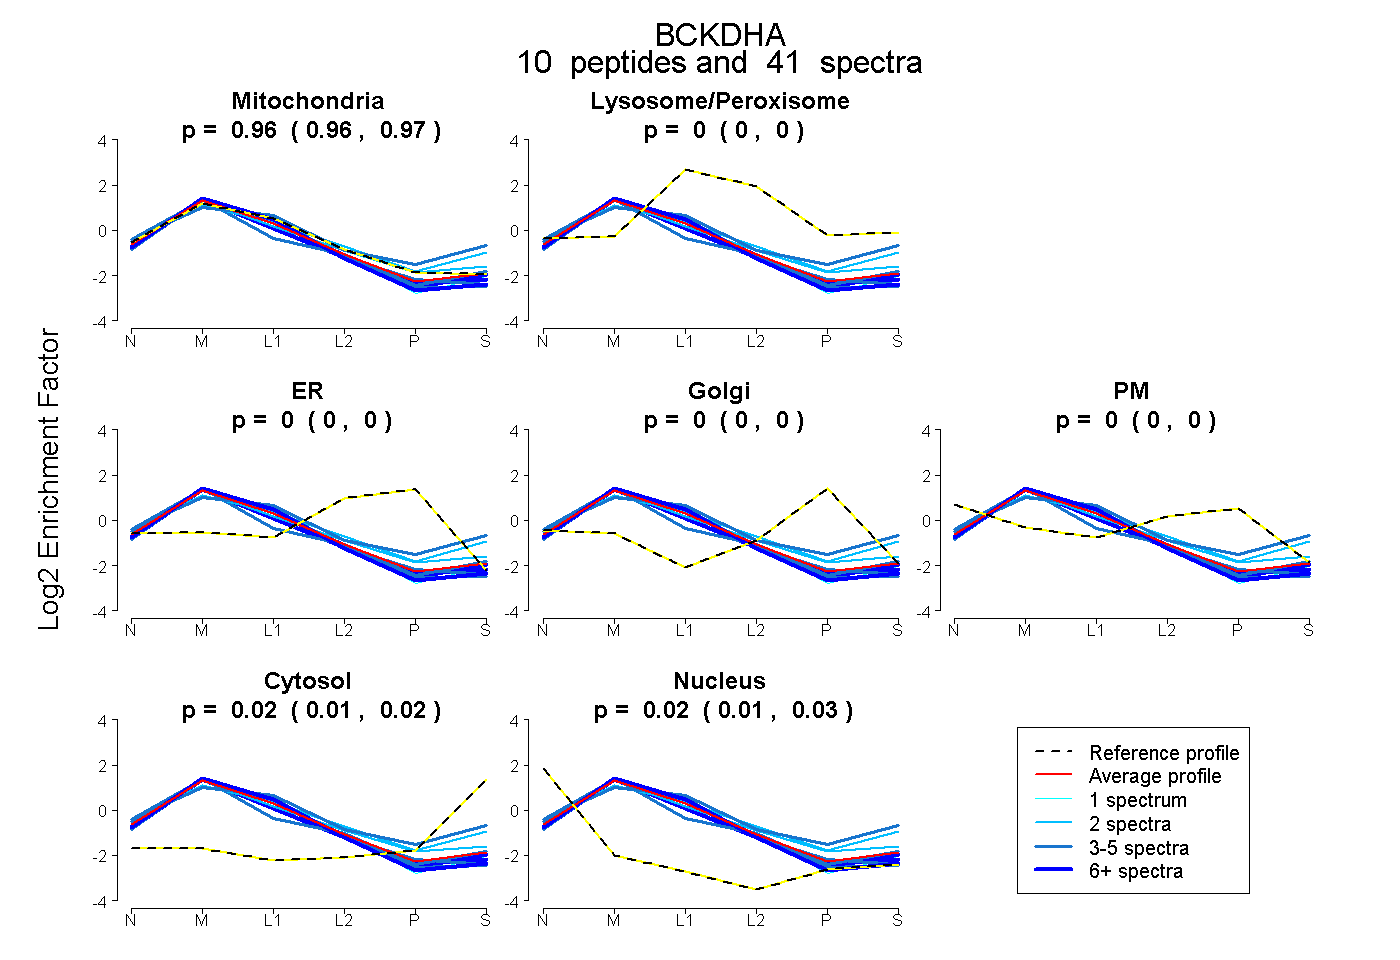
0.957 | 0.968
0.000 | 0.000
0.000 | 0.000
0.000 | 0.000
0.000 | 0.000
0.006 | 0.025
0.014 | 0.026