 16
16peptides
spectra
0.960 | 0.966
0.000 | 0.000
0.000 | 0.000
0.000 | 0.000
0.000 | 0.000
0.000 | 0.000
0.000 | 0.007
0.030 | 0.037
| Plot | Mito | Lyso | Perox | ER | Golgi | PM | Cytosol | Nucleus | |||||
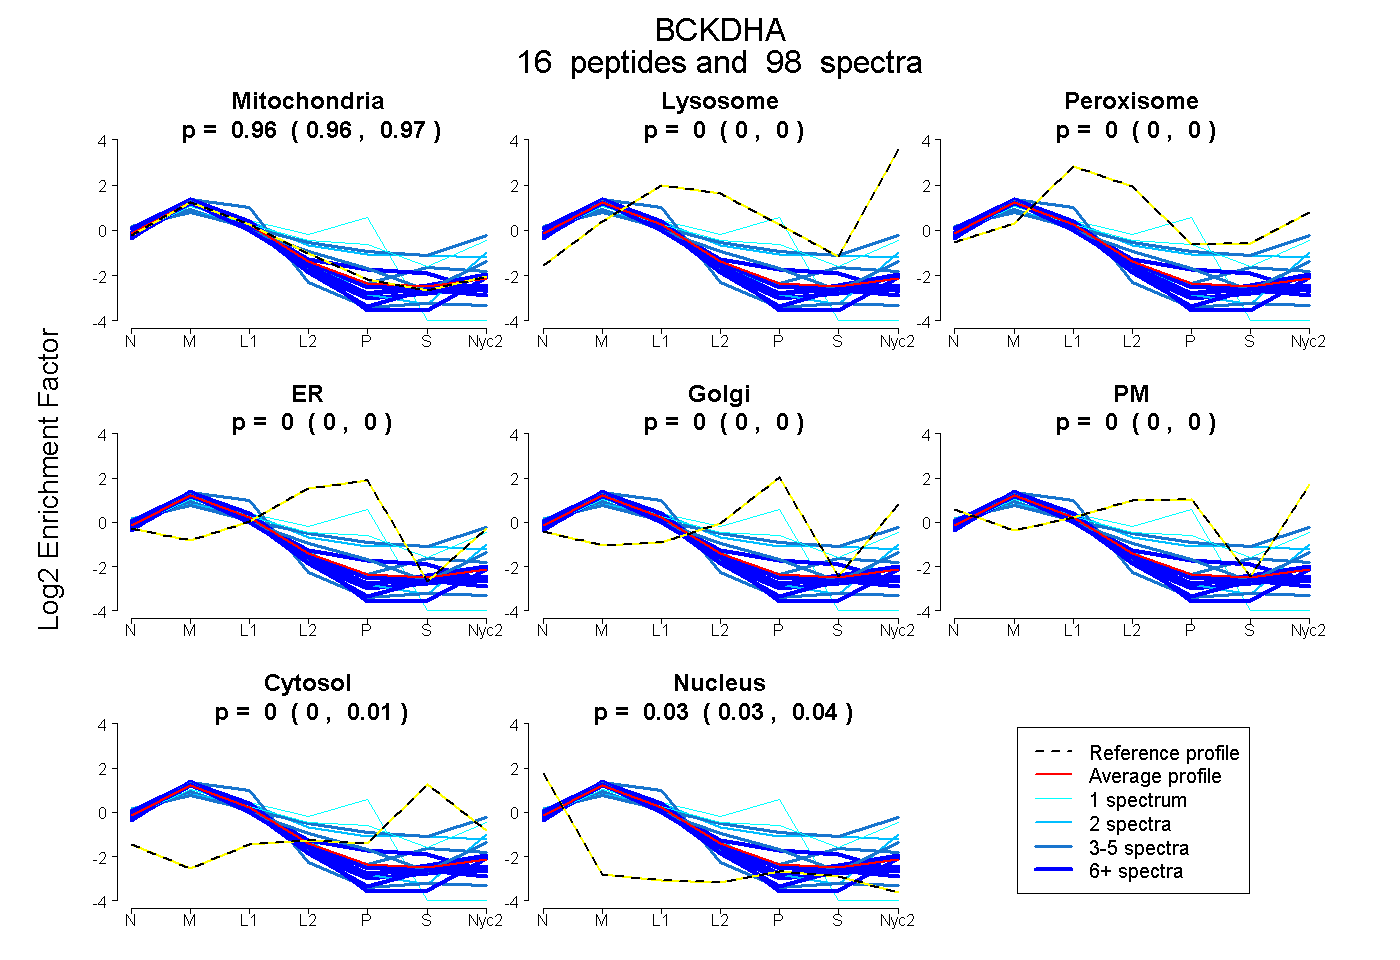
| Expt A |
16 peptides |
98 spectra |
|
0.964 0.960 | 0.966 |
0.000 0.000 | 0.000 |
0.000 0.000 | 0.000 |
0.000 0.000 | 0.000 |
0.000 0.000 | 0.000 |
0.000 0.000 | 0.000 |
0.003 0.000 | 0.007 |
0.034 0.030 | 0.037 |
| 9 spectra, SVDEVNYWDK | 0.911 | 0.000 | 0.000 | 0.000 | 0.000 | 0.000 | 0.000 | 0.089 | ||
| 6 spectra, QQESLAR | 0.928 | 0.000 | 0.000 | 0.000 | 0.000 | 0.000 | 0.000 | 0.072 | ||
| 3 spectra, ISFYMTNYGEEGTHVGSAAALER | 0.924 | 0.000 | 0.000 | 0.000 | 0.000 | 0.000 | 0.000 | 0.076 | ||
| 8 spectra, EAGVLMYR | 0.935 | 0.000 | 0.000 | 0.000 | 0.000 | 0.000 | 0.000 | 0.065 | ||
| 10 spectra, QMPVHYGCK | 0.913 | 0.000 | 0.000 | 0.000 | 0.000 | 0.000 | 0.083 | 0.004 | ||
| 2 spectra, IGHHSTSDDSSAYR | 0.587 | 0.000 | 0.161 | 0.000 | 0.000 | 0.093 | 0.159 | 0.000 | ||
| 4 spectra, TDLVFGQYR | 0.866 | 0.009 | 0.000 | 0.000 | 0.056 | 0.069 | 0.000 | 0.000 | ||
| 6 spectra, QGQIINPSEDPHLPQEEVLK | 0.950 | 0.000 | 0.000 | 0.000 | 0.000 | 0.000 | 0.000 | 0.050 | ||
| 1 spectrum, DYPLELFMAQCYGNVSDPGK | 0.630 | 0.000 | 0.000 | 0.341 | 0.000 | 0.000 | 0.000 | 0.029 | ||
| 3 spectra, GDGIAAR | 0.828 | 0.000 | 0.000 | 0.000 | 0.000 | 0.000 | 0.137 | 0.034 | ||
| 3 spectra, QDHPISR | 0.473 | 0.069 | 0.066 | 0.000 | 0.000 | 0.226 | 0.166 | 0.000 | ||
| 13 spectra, VMEAFEQAER | 0.934 | 0.000 | 0.000 | 0.000 | 0.000 | 0.000 | 0.000 | 0.066 | ||
| 1 spectrum, VDGNDVFAVYNATK | 0.552 | 0.119 | 0.075 | 0.000 | 0.151 | 0.056 | 0.047 | 0.000 | ||
| 17 spectra, SMTLLNTMDR | 0.963 | 0.000 | 0.000 | 0.000 | 0.000 | 0.000 | 0.007 | 0.030 | ||
| 10 spectra, GPGYGIMSIR | 0.937 | 0.000 | 0.000 | 0.000 | 0.000 | 0.000 | 0.000 | 0.063 | ||
| 2 spectra, HLQTYGEHYPLDHFDK | 0.952 | 0.046 | 0.000 | 0.000 | 0.000 | 0.000 | 0.000 | 0.002 |
| Plot | Mito | Lyso or Perox | ER | Golgi | PM | Cytosol | Nucleus | ||||||
| Expt B |
10 peptides |
41 spectra |
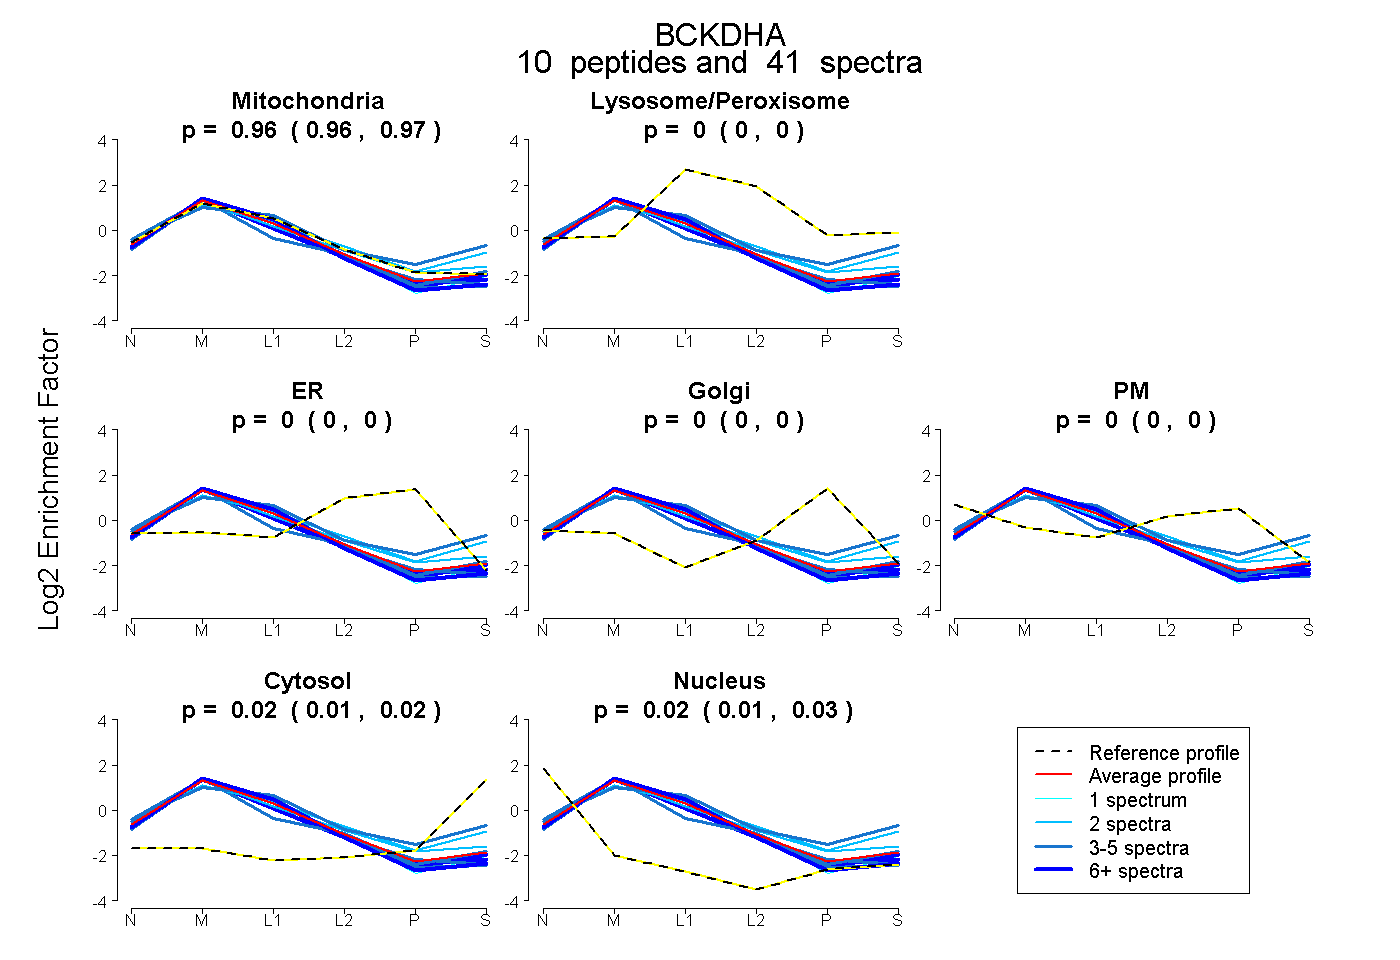 |
0.963 0.957 | 0.968 |
0.000 0.000 | 0.000 |
0.000 0.000 | 0.000 |
0.000 0.000 | 0.000 |
0.000 0.000 | 0.000 |
0.016 0.006 | 0.025 |
0.021 0.014 | 0.026 |
|||
| Plot | Lyso | Other | |||||||||||
| Expt C |
20 peptides |
277 spectra |
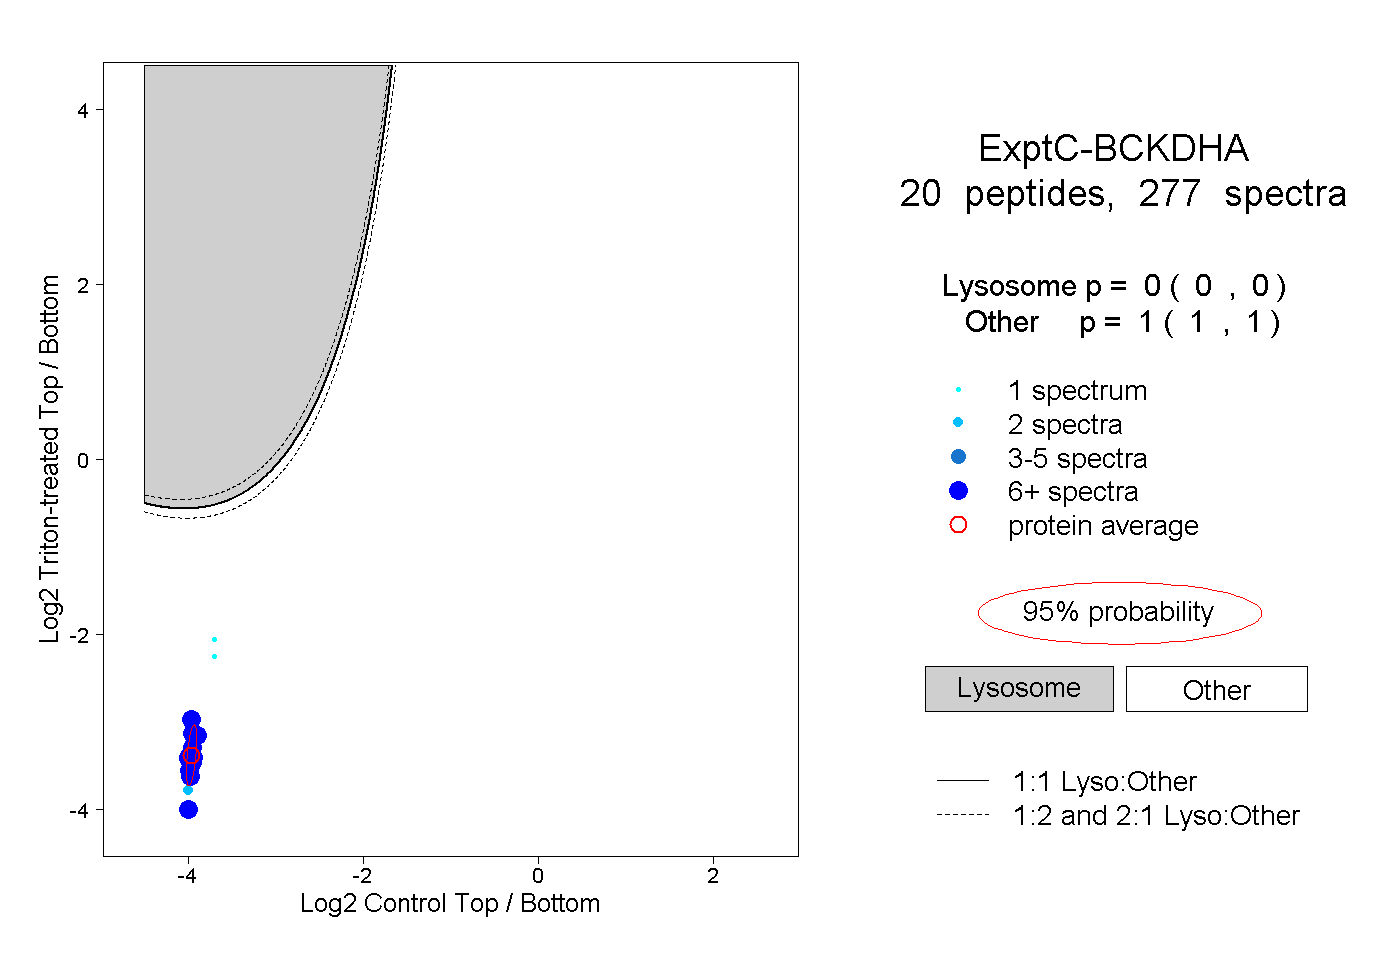 |
0.000 0.000 | 0.000 |
1.000 1.000 | 1.000 |
||||||||
| Plot | Lyso | Other | |||||||||||
| Expt D |
6 peptides |
11 spectra |
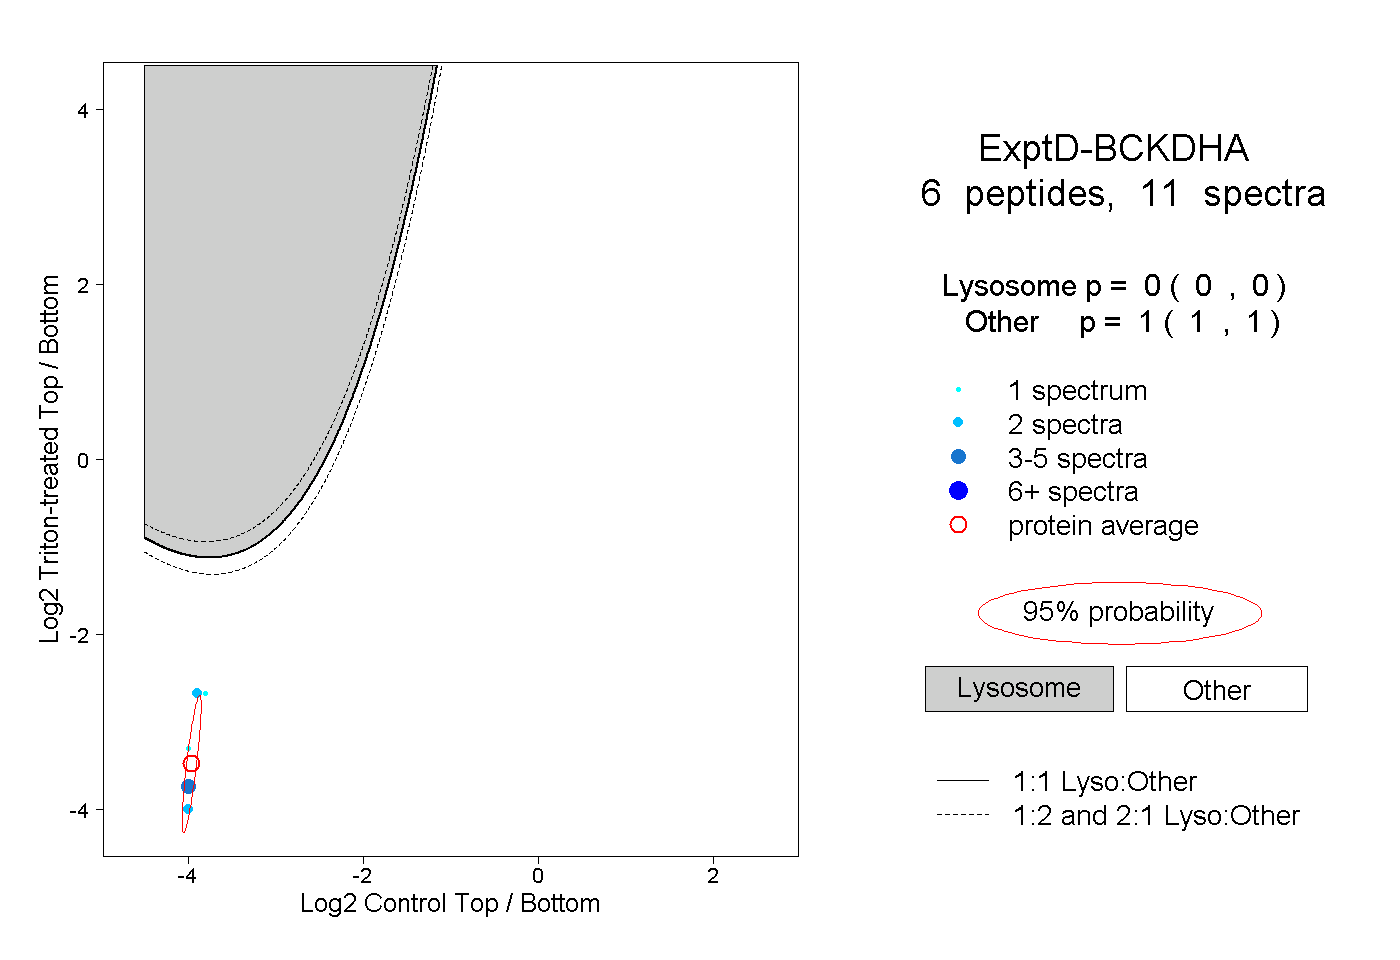 |
0.000 0.000 | 0.000 |
1.000 1.000 | 1.000 |