 13
13peptides
spectra
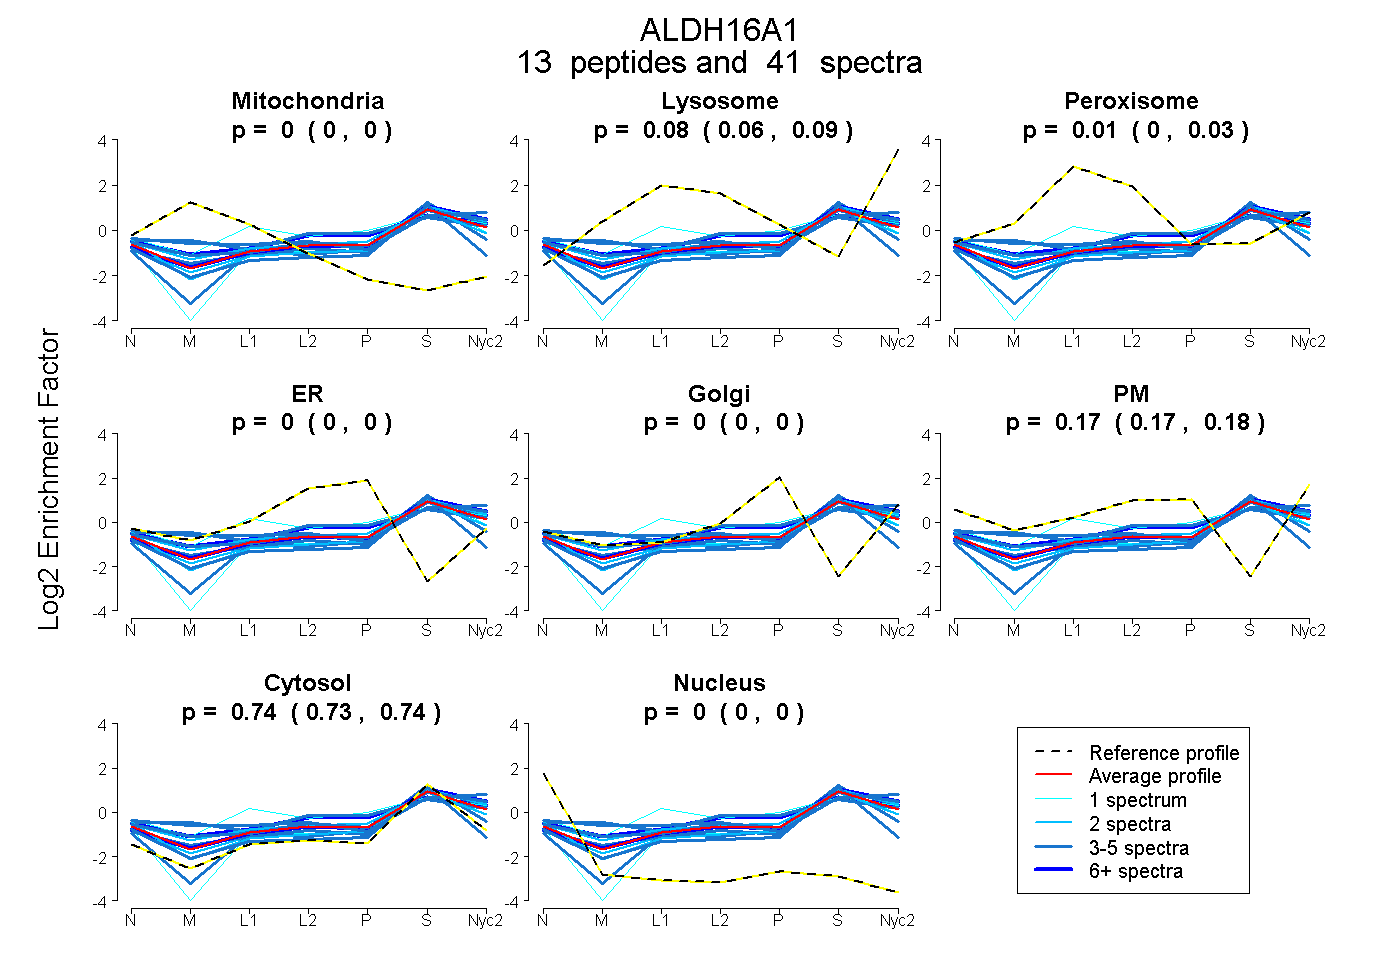
0.000 | 0.000
0.062 | 0.087
0.002 | 0.026
0.000 | 0.000
0.000 | 0.000
0.167 | 0.179
0.730 | 0.741
0.000 | 0.000
7peptides
spectra
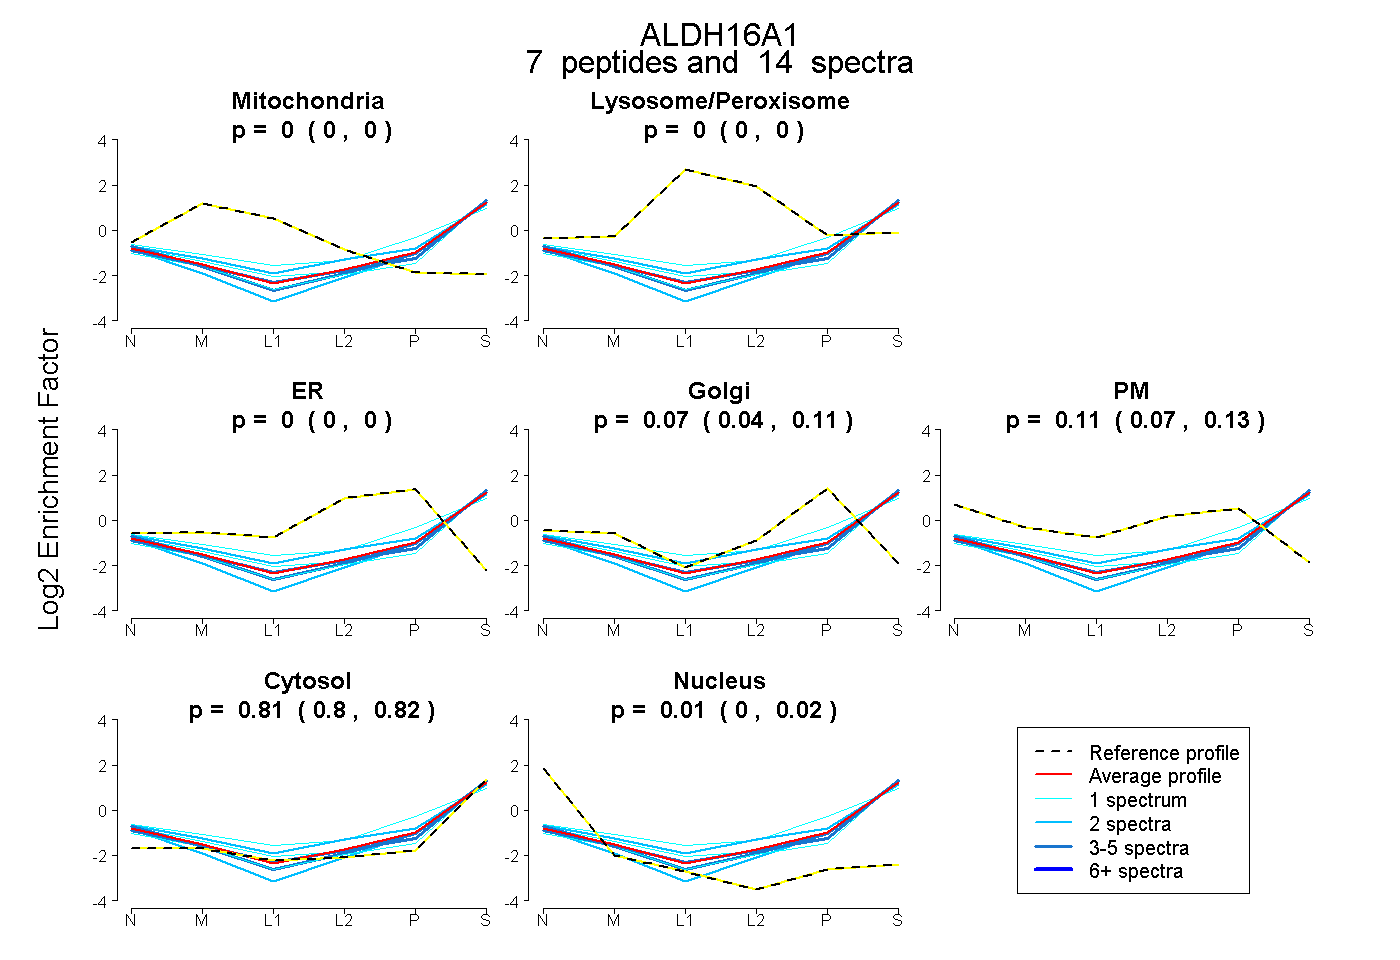
0.000 | 0.000
0.000 | 0.000
0.000 | 0.000
0.036 | 0.105
0.072 | 0.135
0.805 | 0.820
0.000 | 0.016
9peptides
spectra
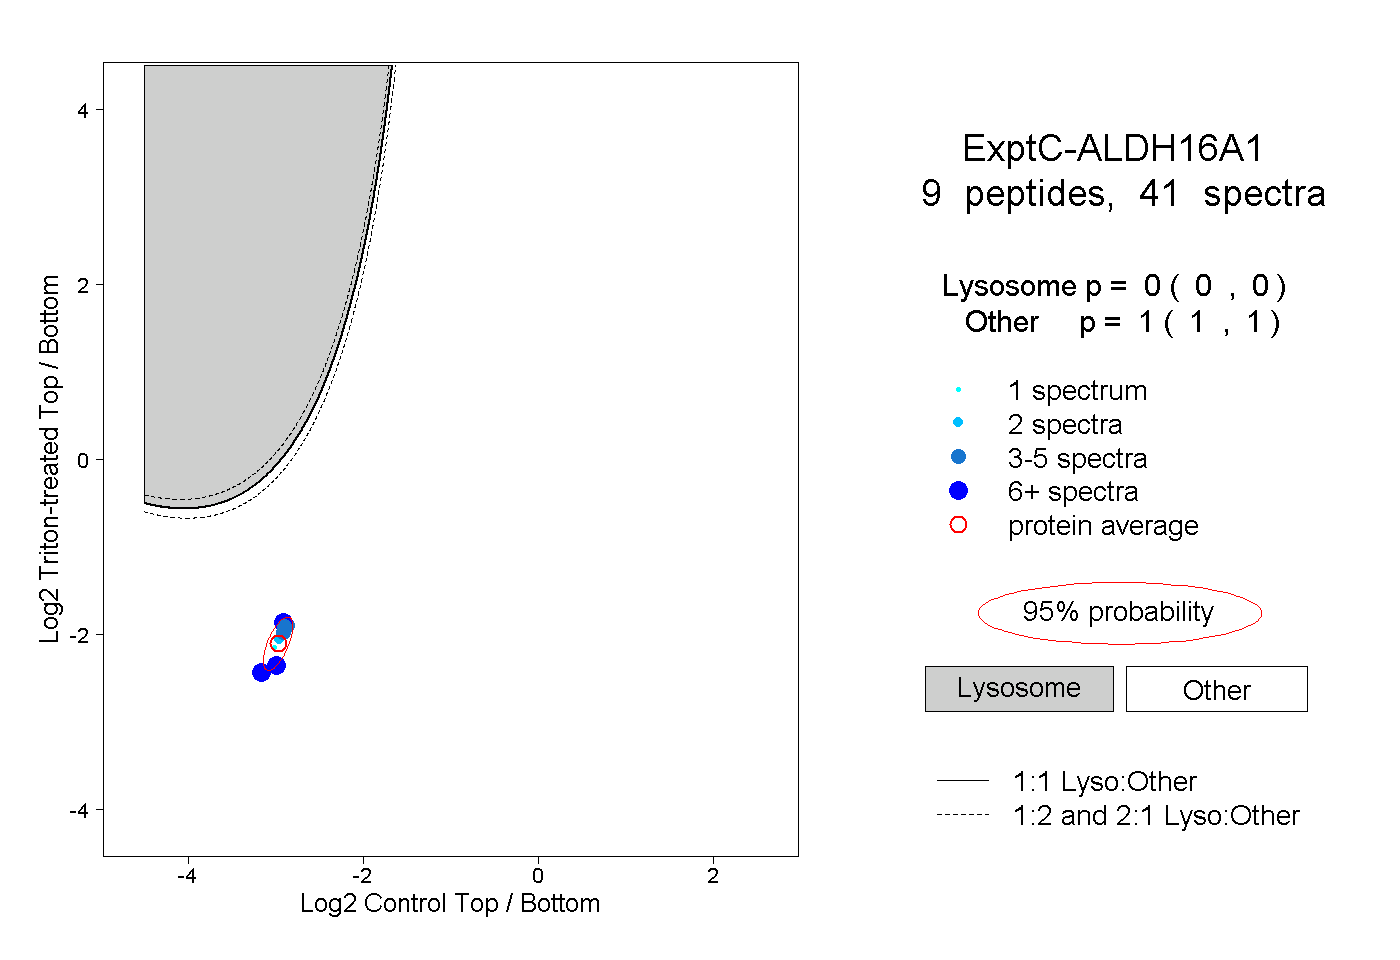
0.000 | 0.000
1.000 | 1.000
2peptides
spectra
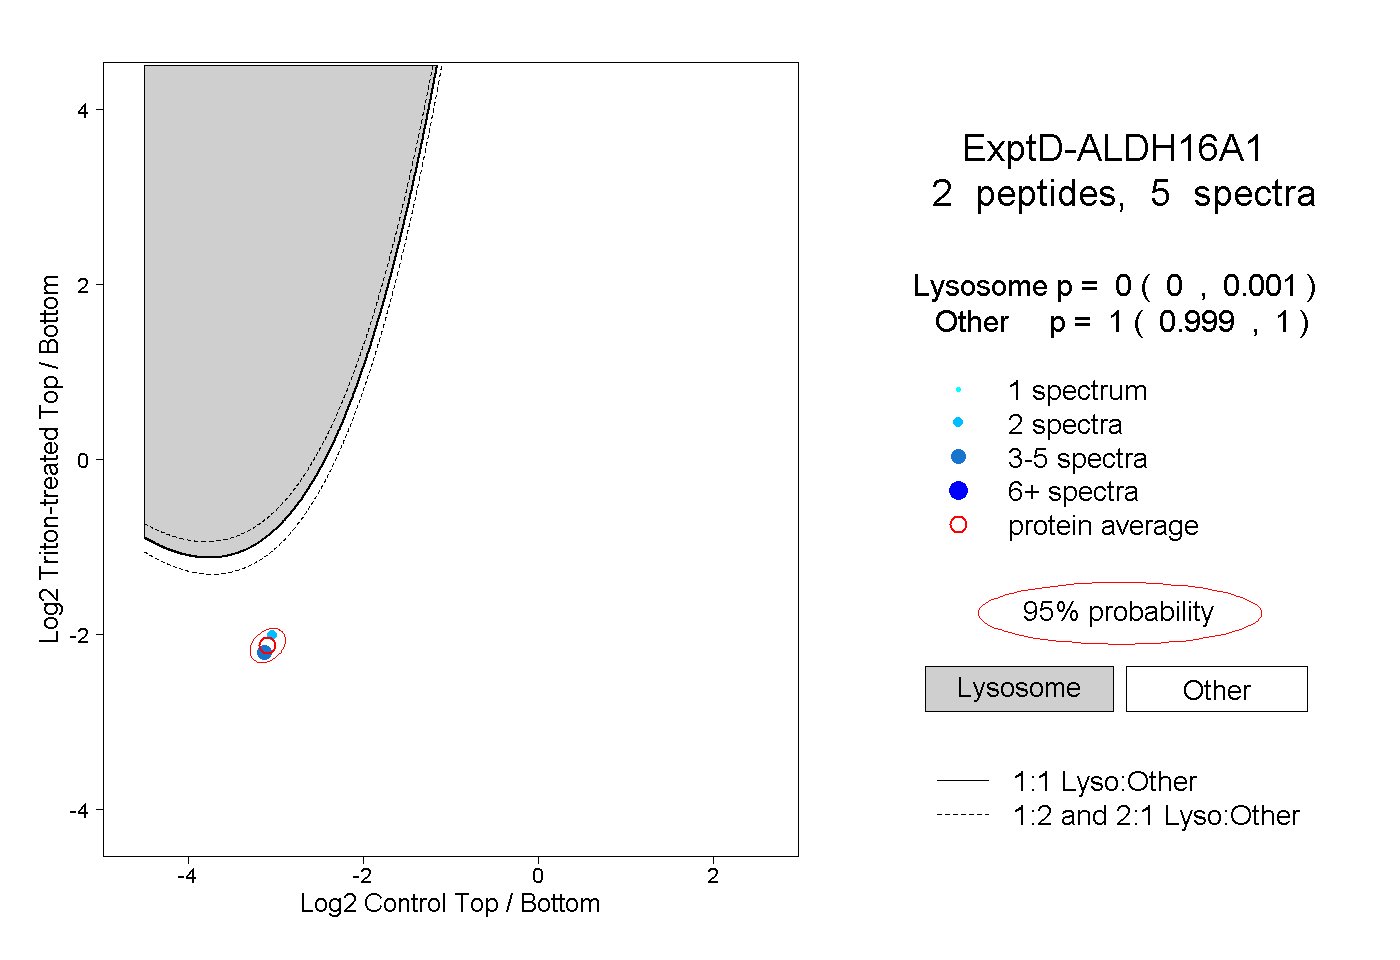
0.000 | 0.001
0.999 | 1.000