ALDH16A1
[ENSRNOP00000027992]
Main page
| | | Plot |
Mito |
Lyso |
|
Perox |
ER |
Golgi |
PM |
Cytosol |
Nucleus |
|
| Expt A |
 13
13
peptides |
41
spectra |
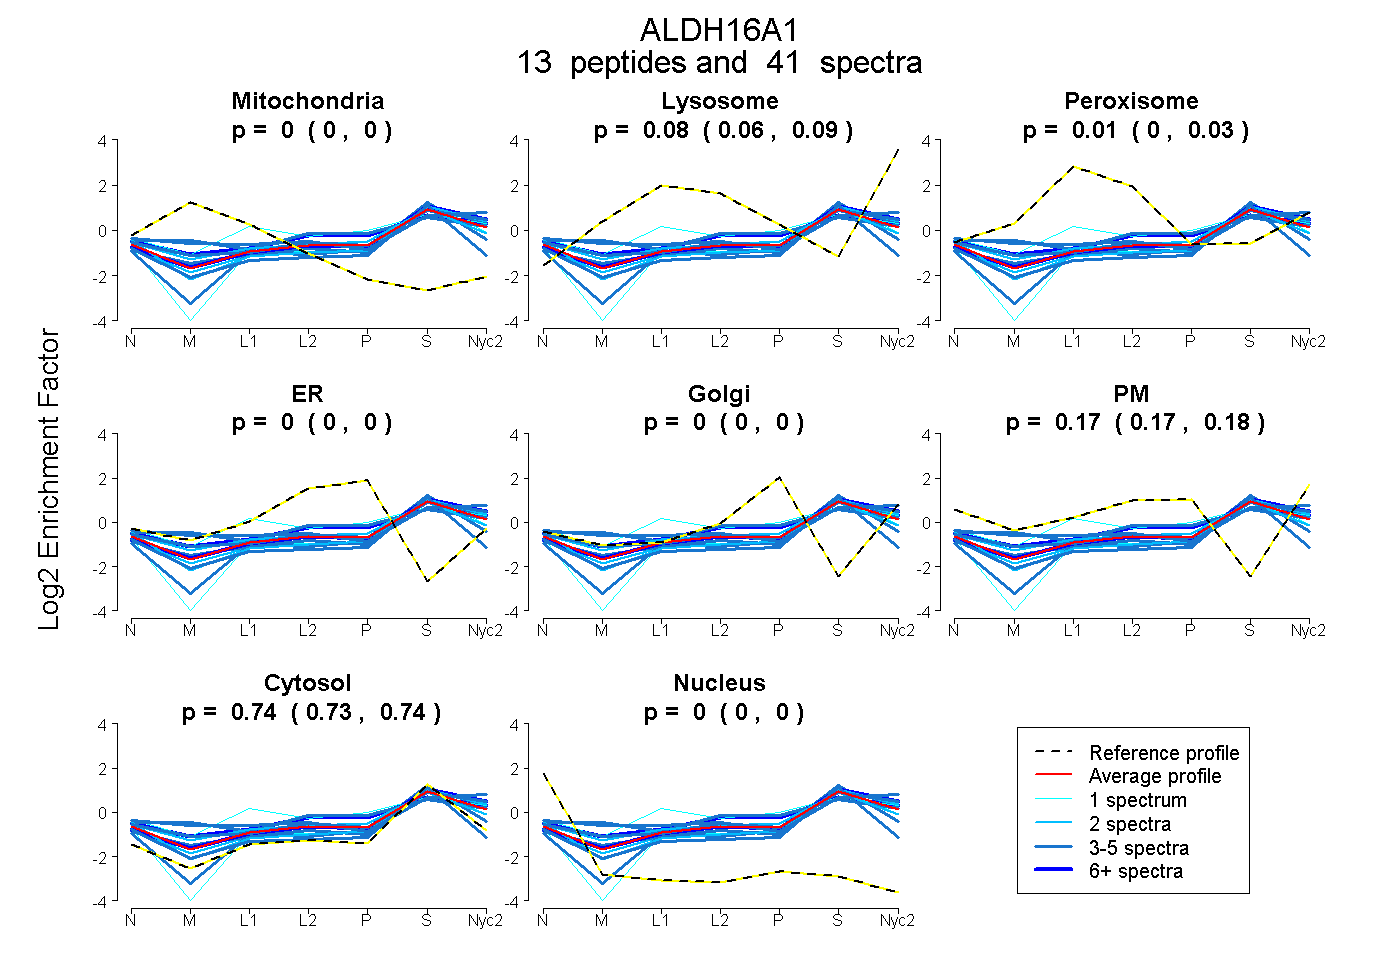 |
0.000
0.000 | 0.000 |
0.076
0.062 | 0.087 |
|
0.015
0.002 | 0.026 |
0.000
0.000 | 0.000 |
0.000
0.000 | 0.000 |
0.173
0.167 | 0.179 |
0.736
0.730 | 0.741 |
0.000
0.000 | 0.000 |
|
| | | Plot |
Mito |
|
Lyso or Perox |
|
ER |
Golgi |
PM |
Cytosol |
Nucleus |
|
| Expt B |
7
peptides |
14
spectra |
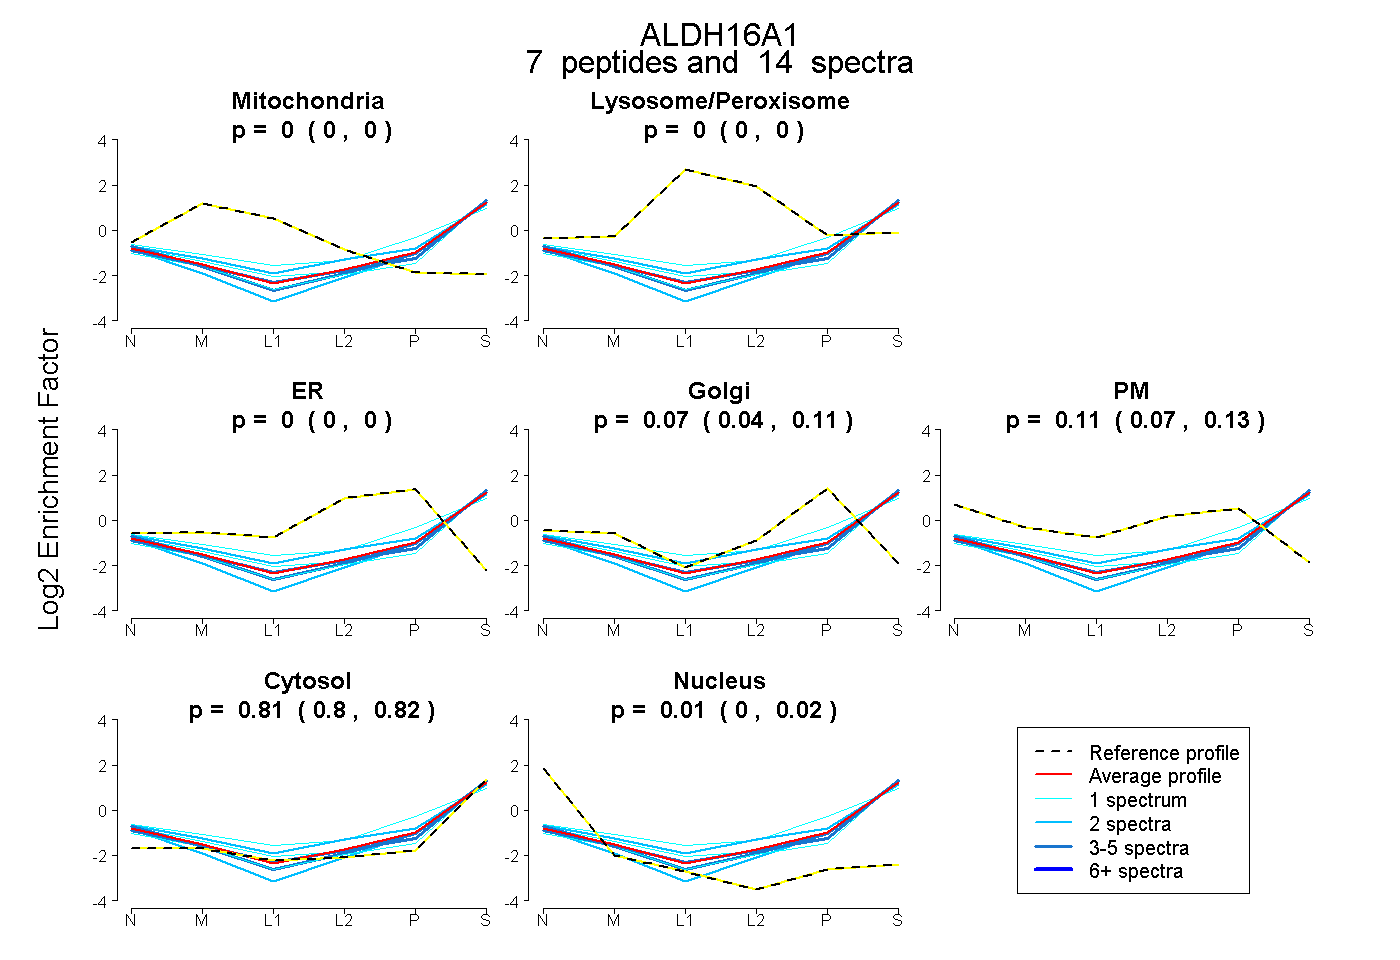 |
0.000
0.000 | 0.000 |
|
0.000
0.000 | 0.000 |
|
0.000
0.000 | 0.000 |
0.075
0.036 | 0.105 |
0.106
0.072 | 0.135 |
0.814
0.805 | 0.820 |
0.006
0.000 | 0.016 |
|
| 1 spectrum, EALALANGTPR |
0.000 |
|
0.000 |
|
0.000 |
0.000 |
0.182 |
0.816 |
0.001 |
|
| 4 spectra, VAFCGAVEEGR |
0.000 |
|
0.000 |
|
0.000 |
0.001 |
0.123 |
0.861 |
0.015 |
|
| 2 spectra, LQTWATR |
0.000 |
|
0.033 |
|
0.000 |
0.000 |
0.235 |
0.731 |
0.000 |
|
| 3 spectra, QVLAAQLER |
0.000 |
|
0.000 |
|
0.000 |
0.143 |
0.000 |
0.807 |
0.050 |
|
| 2 spectra, IQPSTR |
0.000 |
|
0.000 |
|
0.000 |
0.095 |
0.000 |
0.838 |
0.067 |
|
| 1 spectrum, TWSQLPGTAR |
0.000 |
|
0.000 |
|
0.000 |
0.054 |
0.001 |
0.892 |
0.053 |
|
| 1 spectrum, GLDGAVDMGAR |
0.000 |
|
0.114 |
|
0.000 |
0.189 |
0.082 |
0.615 |
0.000 |
|
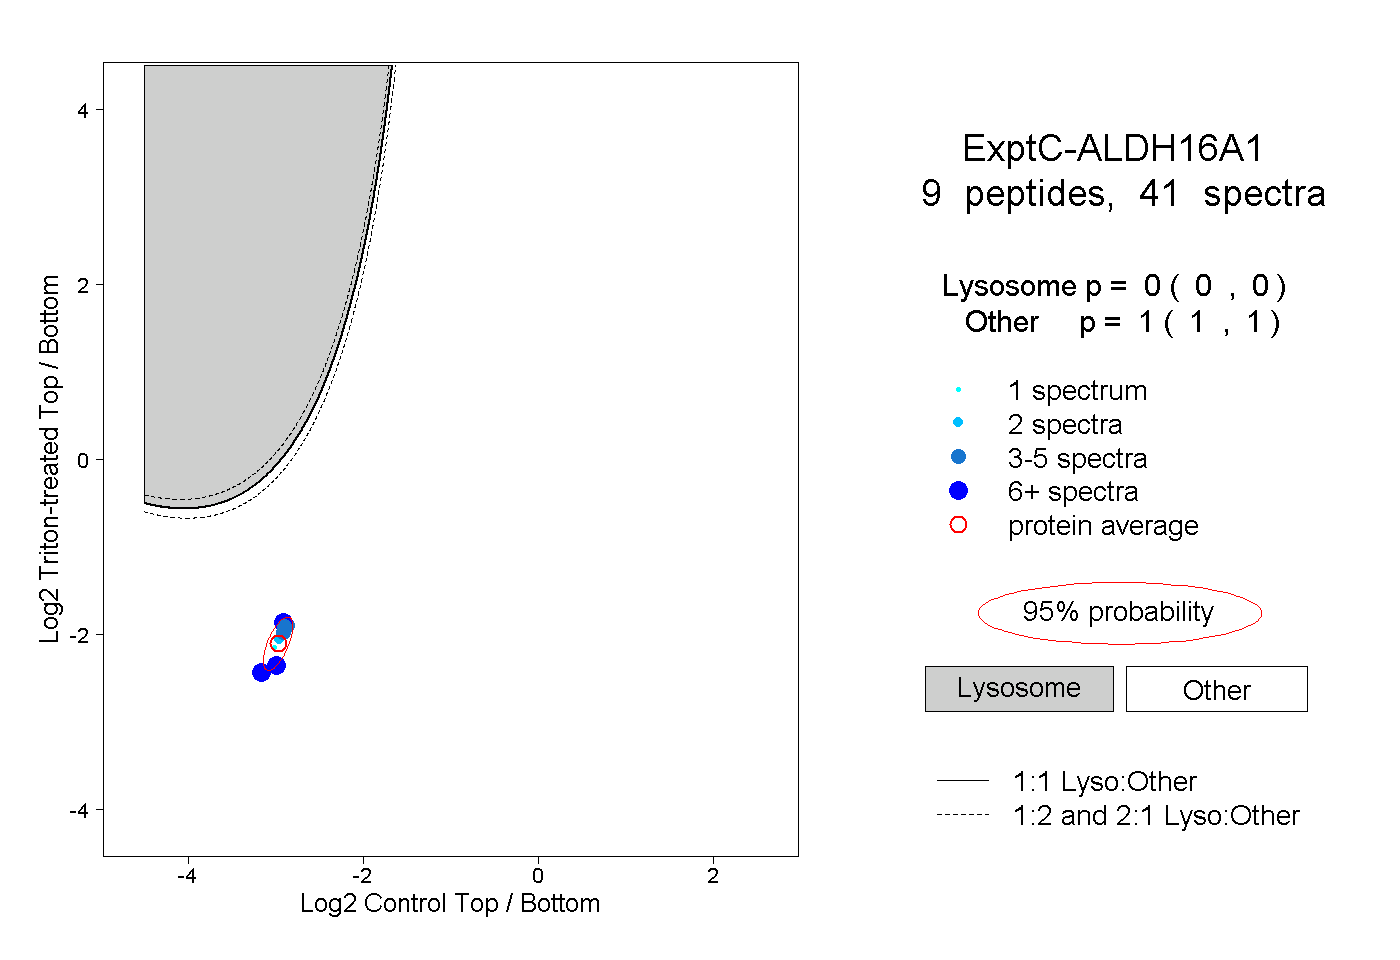
| | | Plot |
|
Lyso |
|
|
|
|
|
|
|
Other |
| Expt C |
9
peptides |
41
spectra |
 |
|
0.000
0.000 | 0.000 |
|
|
|
|
|
|
|
1.000
1.000 | 1.000 |
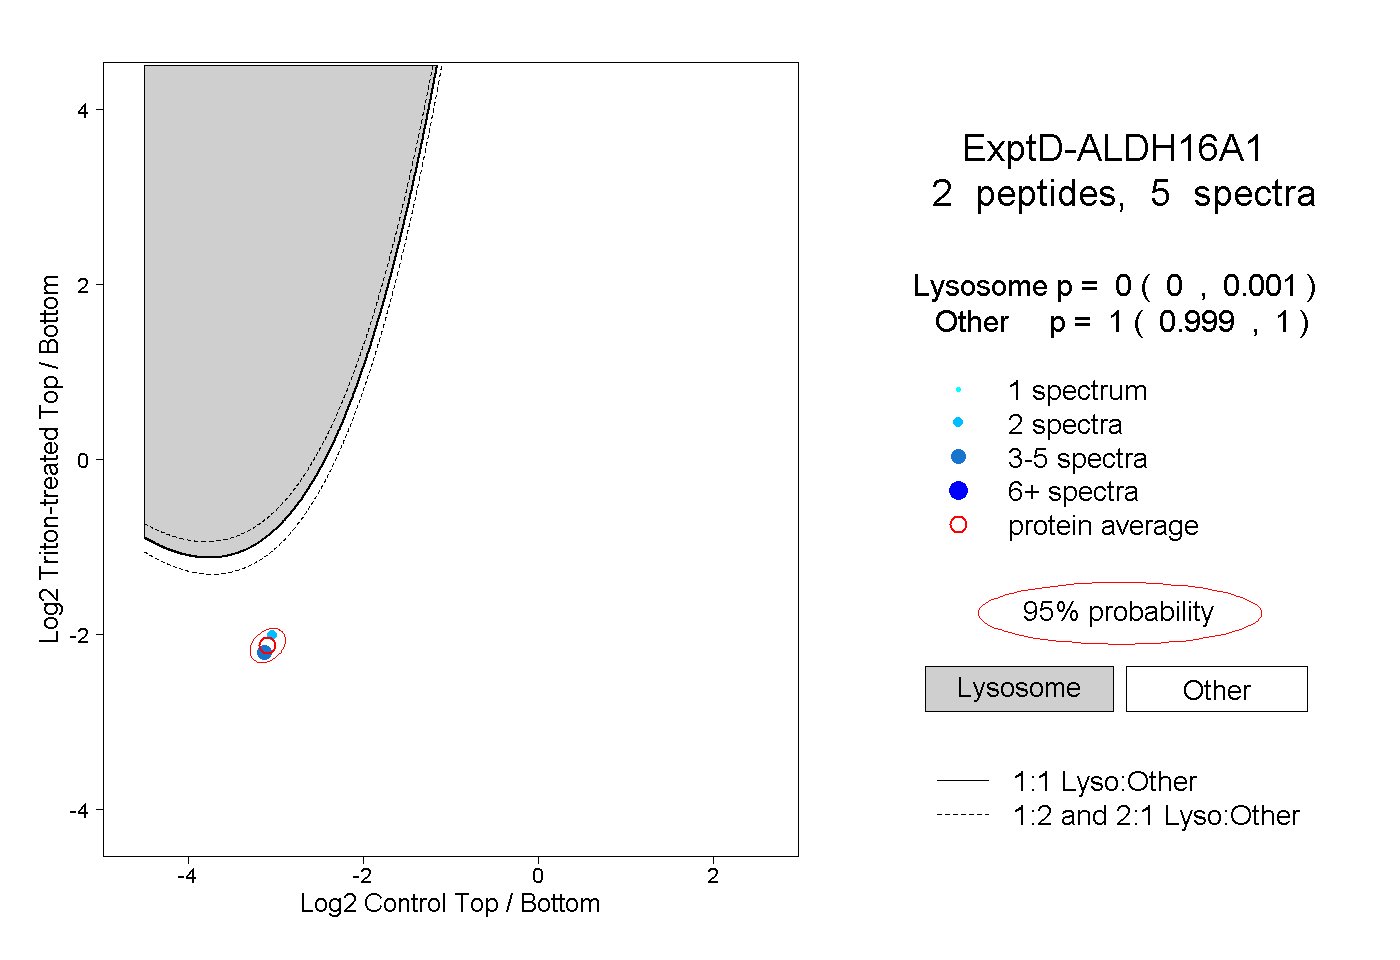
| | | Plot |
|
Lyso |
|
|
|
|
|
|
|
Other |
| Expt D |
2
peptides |
5
spectra |
 |
|
0.000
0.000 | 0.001 |
|
|
|
|
|
|
|
1.000
0.999 | 1.000 |