 13
13peptides
spectra
0.000 | 0.000
0.062 | 0.087
0.002 | 0.026
0.000 | 0.000
0.000 | 0.000
0.167 | 0.179
0.730 | 0.741
0.000 | 0.000
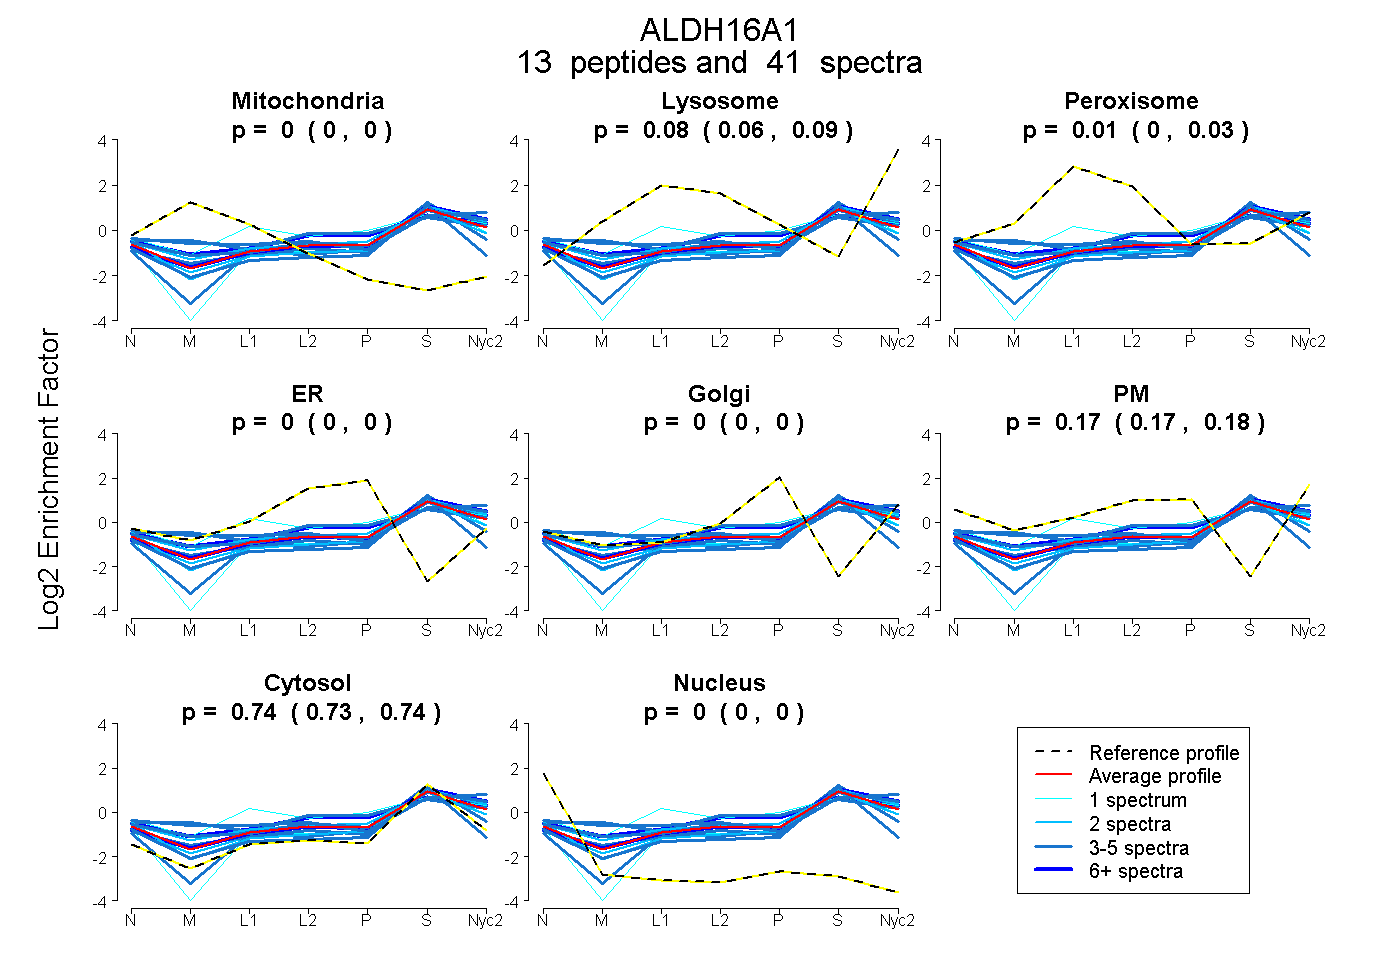
| Plot | Mito | Lyso | Perox | ER | Golgi | PM | Cytosol | Nucleus | |||||
| Expt A |
13 peptides |
41 spectra |
|
0.000 0.000 | 0.000 |
0.076 0.062 | 0.087 |
0.015 0.002 | 0.026 |
0.000 0.000 | 0.000 |
0.000 0.000 | 0.000 |
0.173 0.167 | 0.179 |
0.736 0.730 | 0.741 |
0.000 0.000 | 0.000 |
| 1 spectrum, HGAAPTVAETEVELSVR | 0.000 | 0.019 | 0.261 | 0.000 | 0.046 | 0.167 | 0.507 | 0.000 | ||
| 2 spectra, EALALANGTPR | 0.000 | 0.127 | 0.000 | 0.000 | 0.000 | 0.115 | 0.759 | 0.000 | ||
| 3 spectra, VSSYVAEGGAK | 0.065 | 0.234 | 0.000 | 0.000 | 0.000 | 0.132 | 0.569 | 0.000 | ||
| 4 spectra, VAFCGAVEEGR | 0.007 | 0.000 | 0.050 | 0.024 | 0.000 | 0.000 | 0.854 | 0.066 | ||
| 2 spectra, QTLAGR | 0.000 | 0.000 | 0.109 | 0.000 | 0.000 | 0.200 | 0.691 | 0.000 | ||
| 6 spectra, LQTWATR | 0.000 | 0.160 | 0.000 | 0.000 | 0.000 | 0.105 | 0.736 | 0.000 | ||
| 3 spectra, LLGHYVNGMWLKPEHR | 0.020 | 0.041 | 0.093 | 0.000 | 0.000 | 0.300 | 0.546 | 0.000 | ||
| 1 spectrum, FQSPGTQSSRPIK | 0.000 | 0.000 | 0.000 | 0.000 | 0.000 | 0.069 | 0.931 | 0.000 | ||
| 2 spectra, QVLAAQLER | 0.000 | 0.036 | 0.000 | 0.000 | 0.000 | 0.175 | 0.790 | 0.000 | ||
| 6 spectra, DPAVPTGGCK | 0.000 | 0.073 | 0.053 | 0.000 | 0.000 | 0.272 | 0.603 | 0.000 | ||
| 3 spectra, TWSQLPGTAR | 0.000 | 0.142 | 0.000 | 0.000 | 0.000 | 0.183 | 0.675 | 0.000 | ||
| 4 spectra, GAVEAAHQAAPGWGAQSPR | 0.000 | 0.000 | 0.000 | 0.000 | 0.001 | 0.074 | 0.925 | 0.000 | ||
| 4 spectra, GLDGAVDMGAR | 0.000 | 0.155 | 0.000 | 0.000 | 0.000 | 0.068 | 0.777 | 0.000 |
| Plot | Mito | Lyso or Perox | ER | Golgi | PM | Cytosol | Nucleus | ||||||
| Expt B |
7 peptides |
14 spectra |
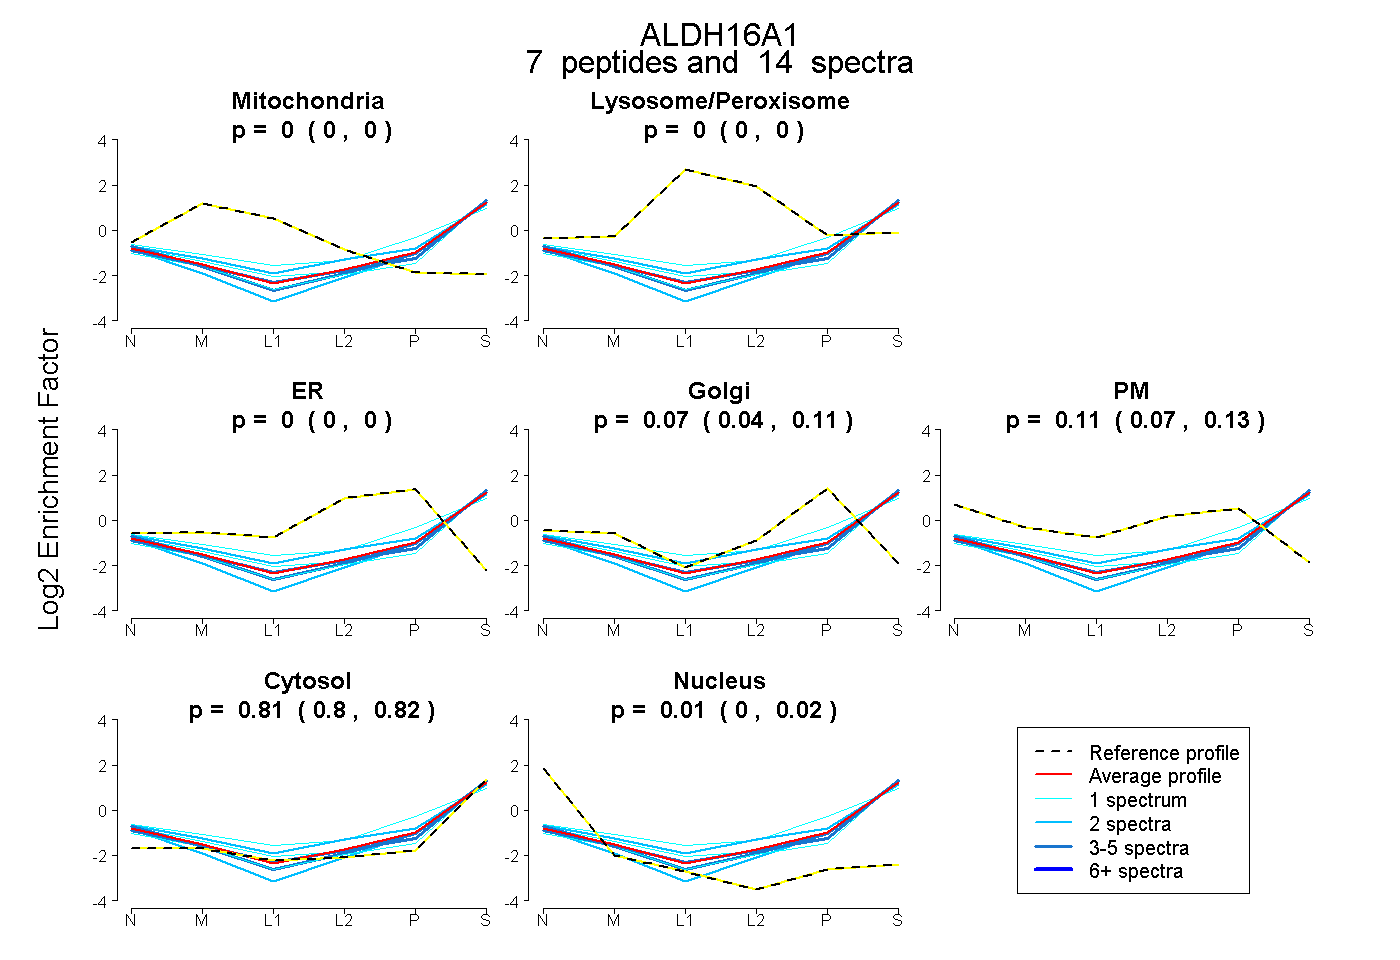 |
0.000 0.000 | 0.000 |
0.000 0.000 | 0.000 |
0.000 0.000 | 0.000 |
0.075 0.036 | 0.105 |
0.106 0.072 | 0.135 |
0.814 0.805 | 0.820 |
0.006 0.000 | 0.016 |
|||
| Plot | Lyso | Other | |||||||||||
| Expt C |
9 peptides |
41 spectra |
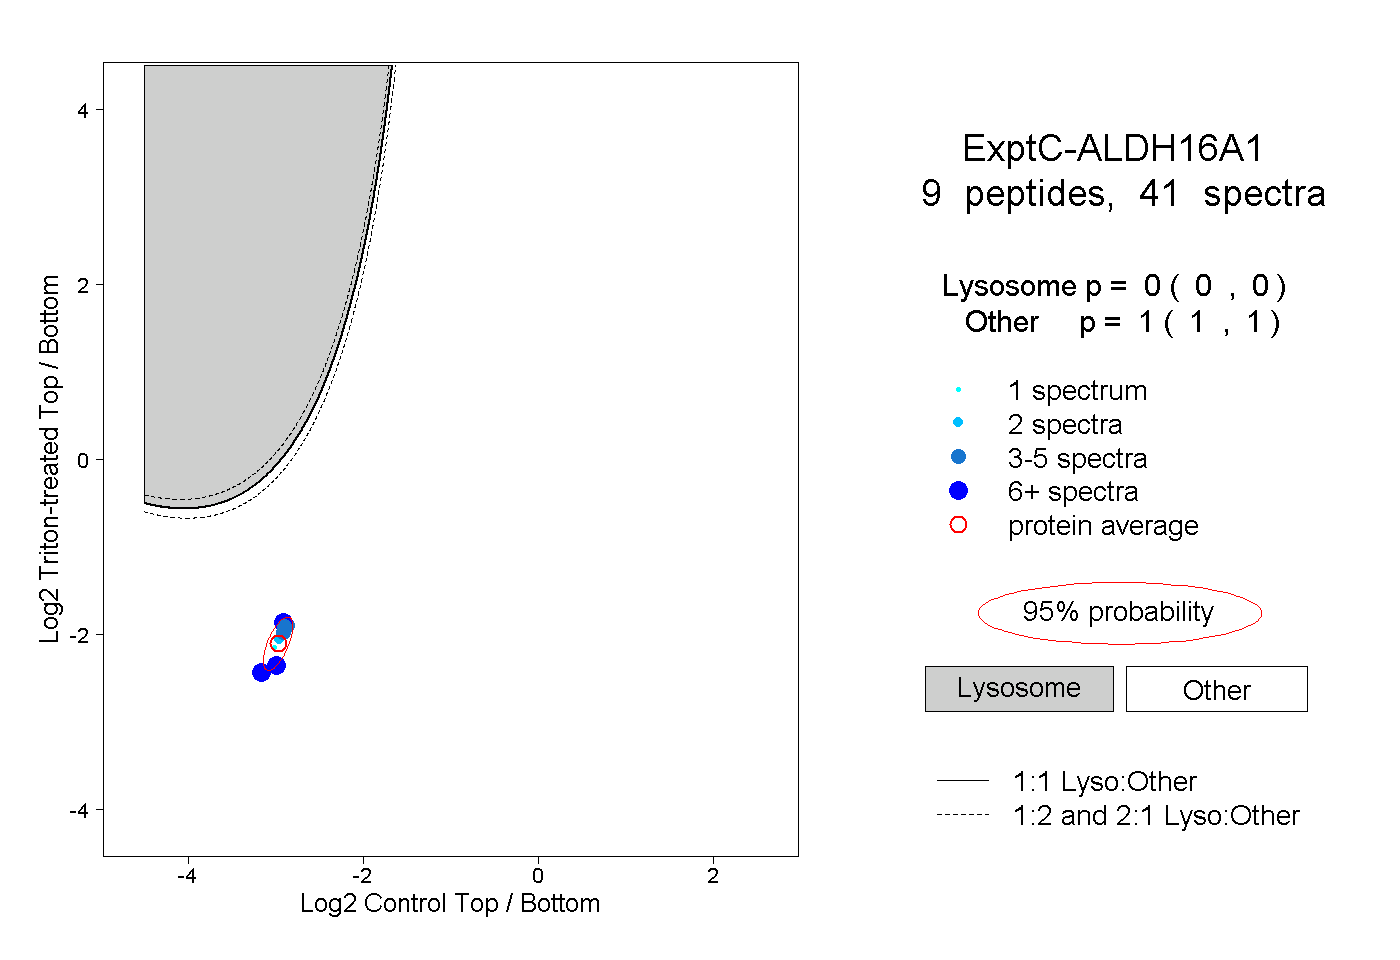 |
0.000 0.000 | 0.000 |
1.000 1.000 | 1.000 |
||||||||
| Plot | Lyso | Other | |||||||||||
| Expt D |
2 peptides |
5 spectra |
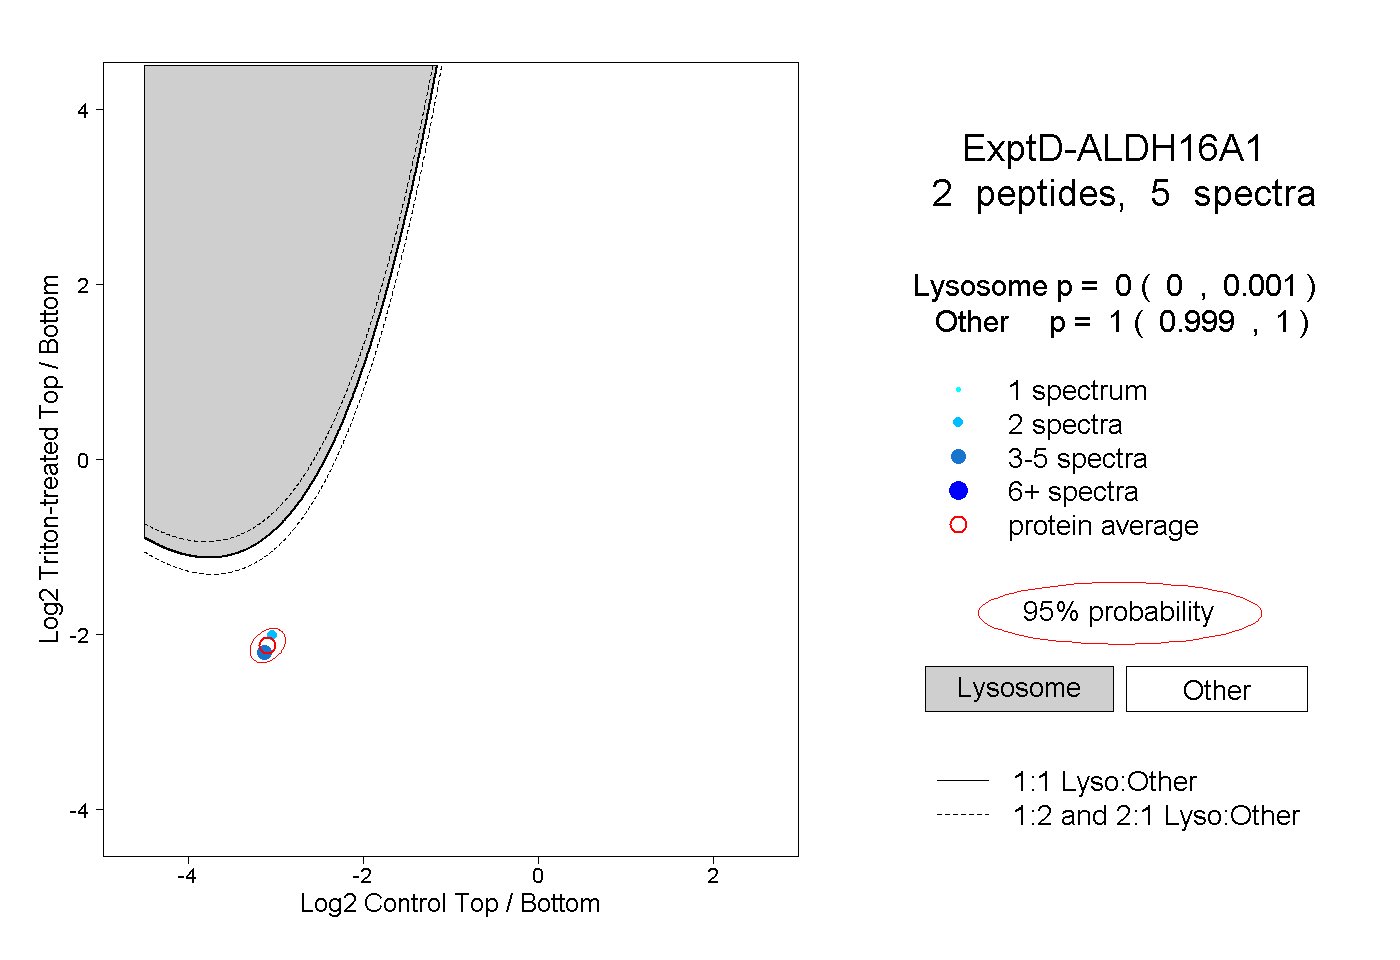 |
0.000 0.000 | 0.001 |
1.000 0.999 | 1.000 |