 4
4peptides
spectra
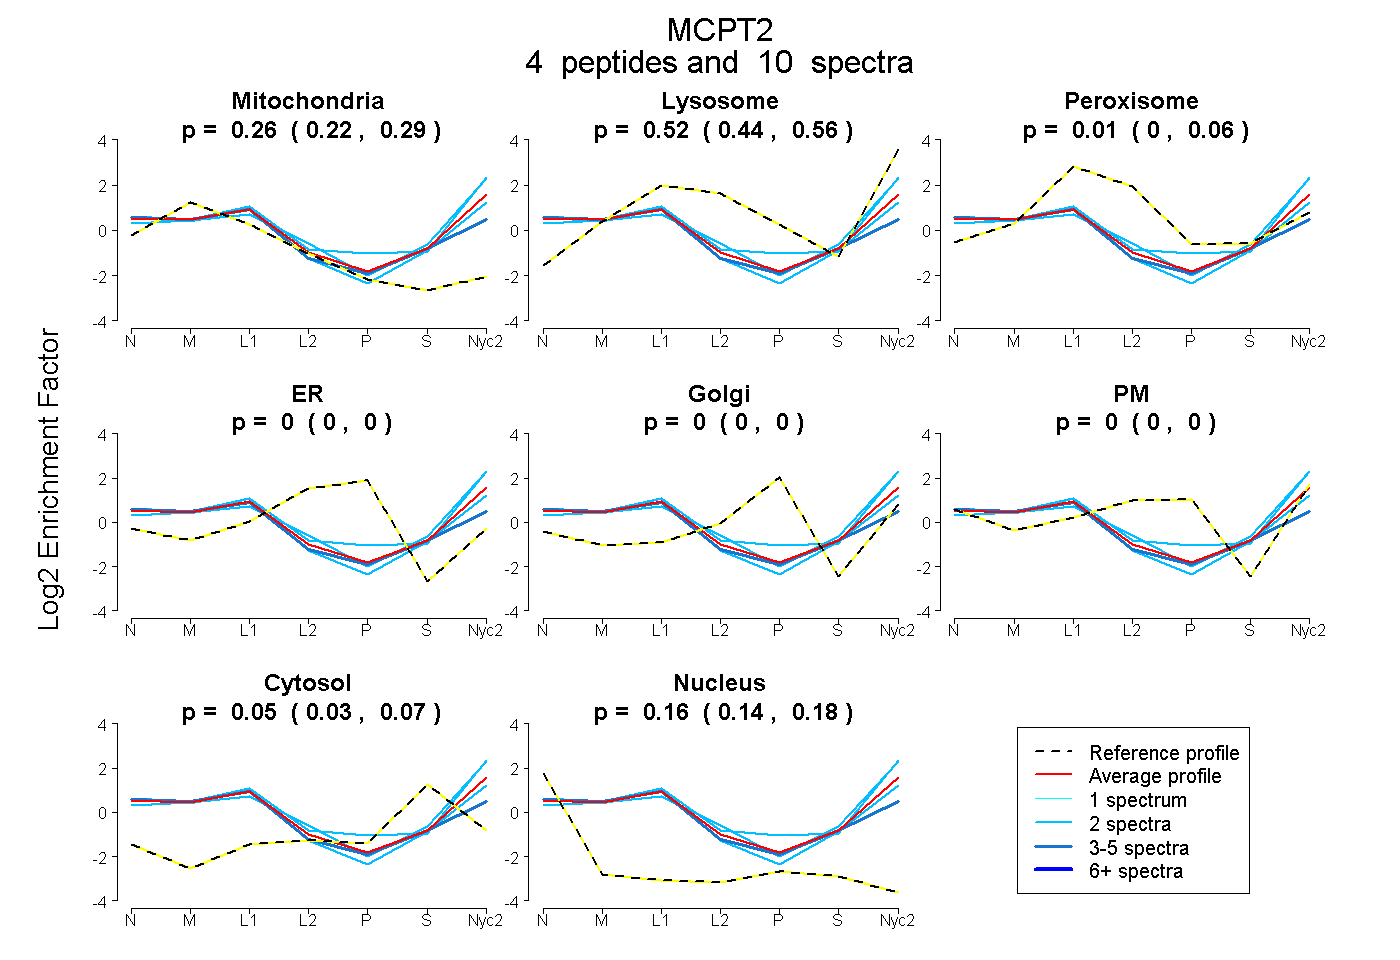
0.217 | 0.287
0.440 | 0.564
0.000 | 0.060
0.000 | 0.000
0.000 | 0.000
0.000 | 0.000
0.031 | 0.066
0.143 | 0.175
2peptides
spectra
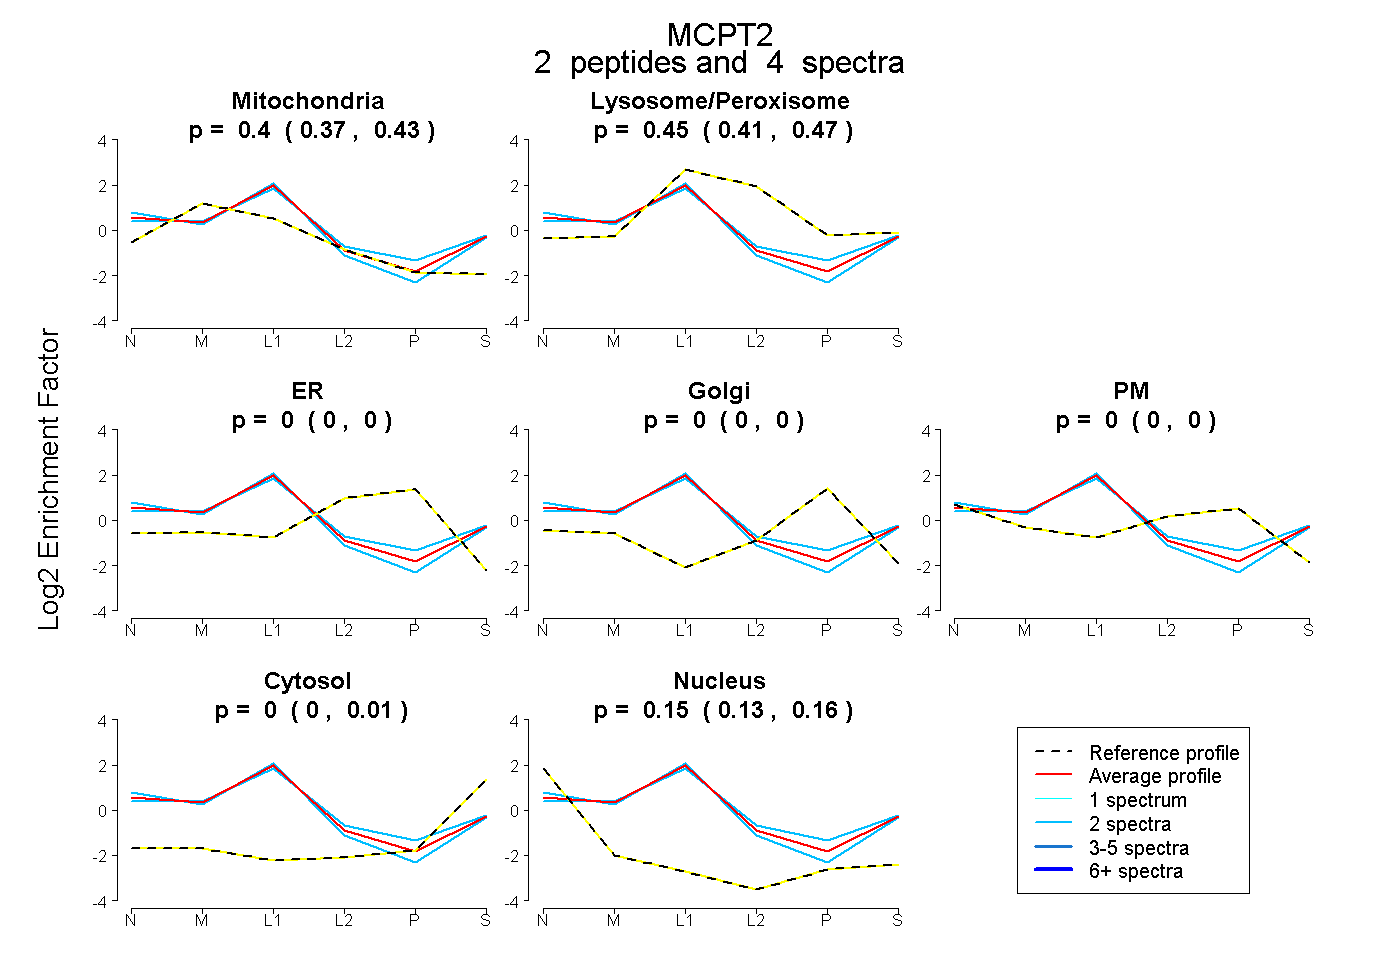
0.369 | 0.435
0.413 | 0.470
0.000 | 0.000
0.000 | 0.000
0.000 | 0.000
0.000 | 0.010
0.132 | 0.165
8peptides
spectra
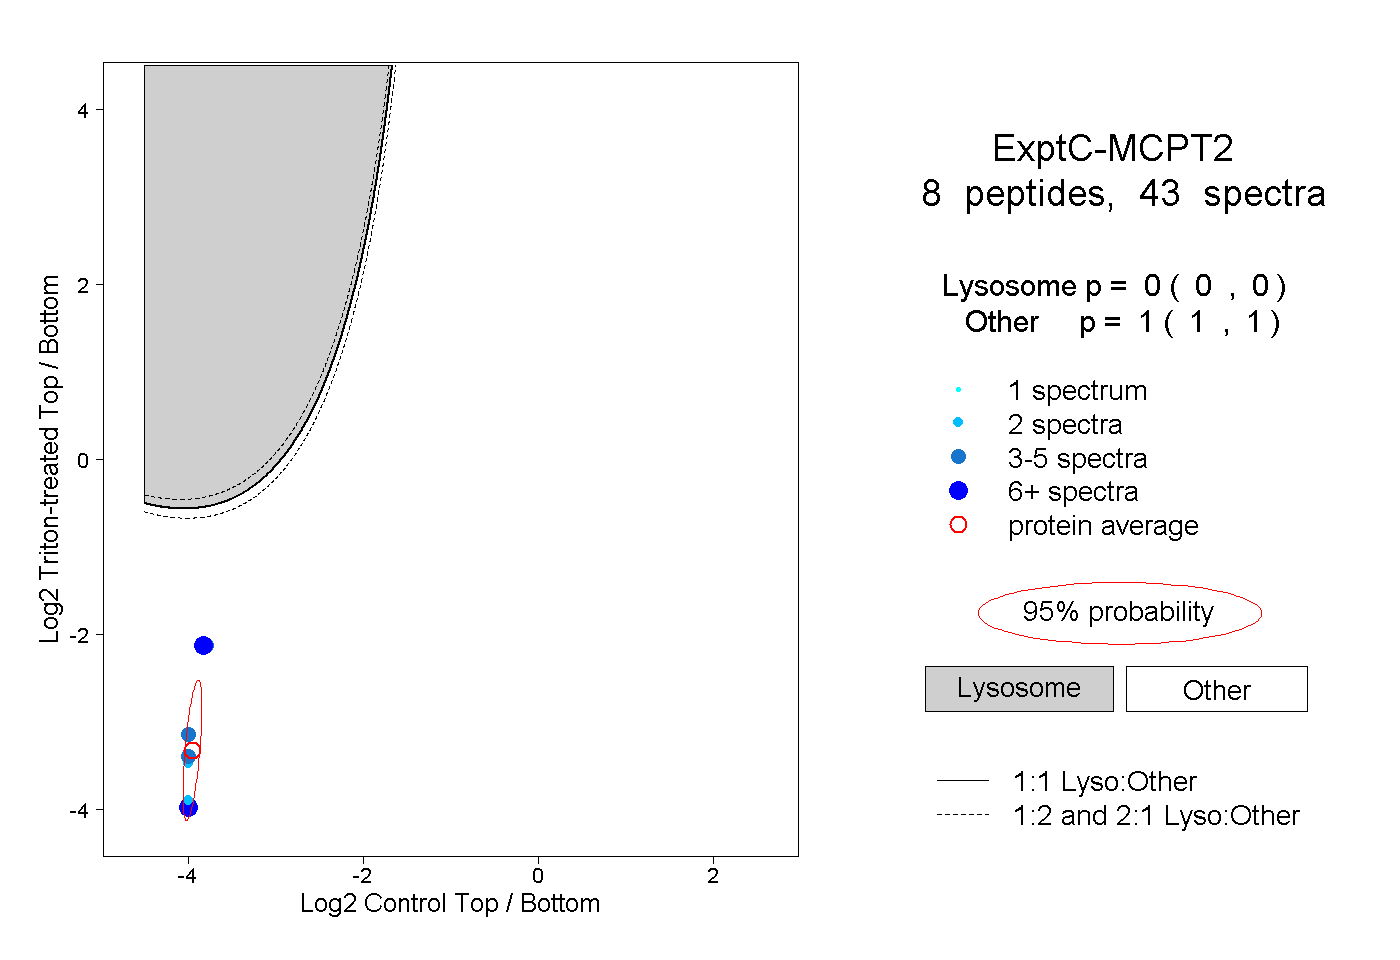
0.000 | 0.000
1.000 | 1.000