9
9peptides
spectra
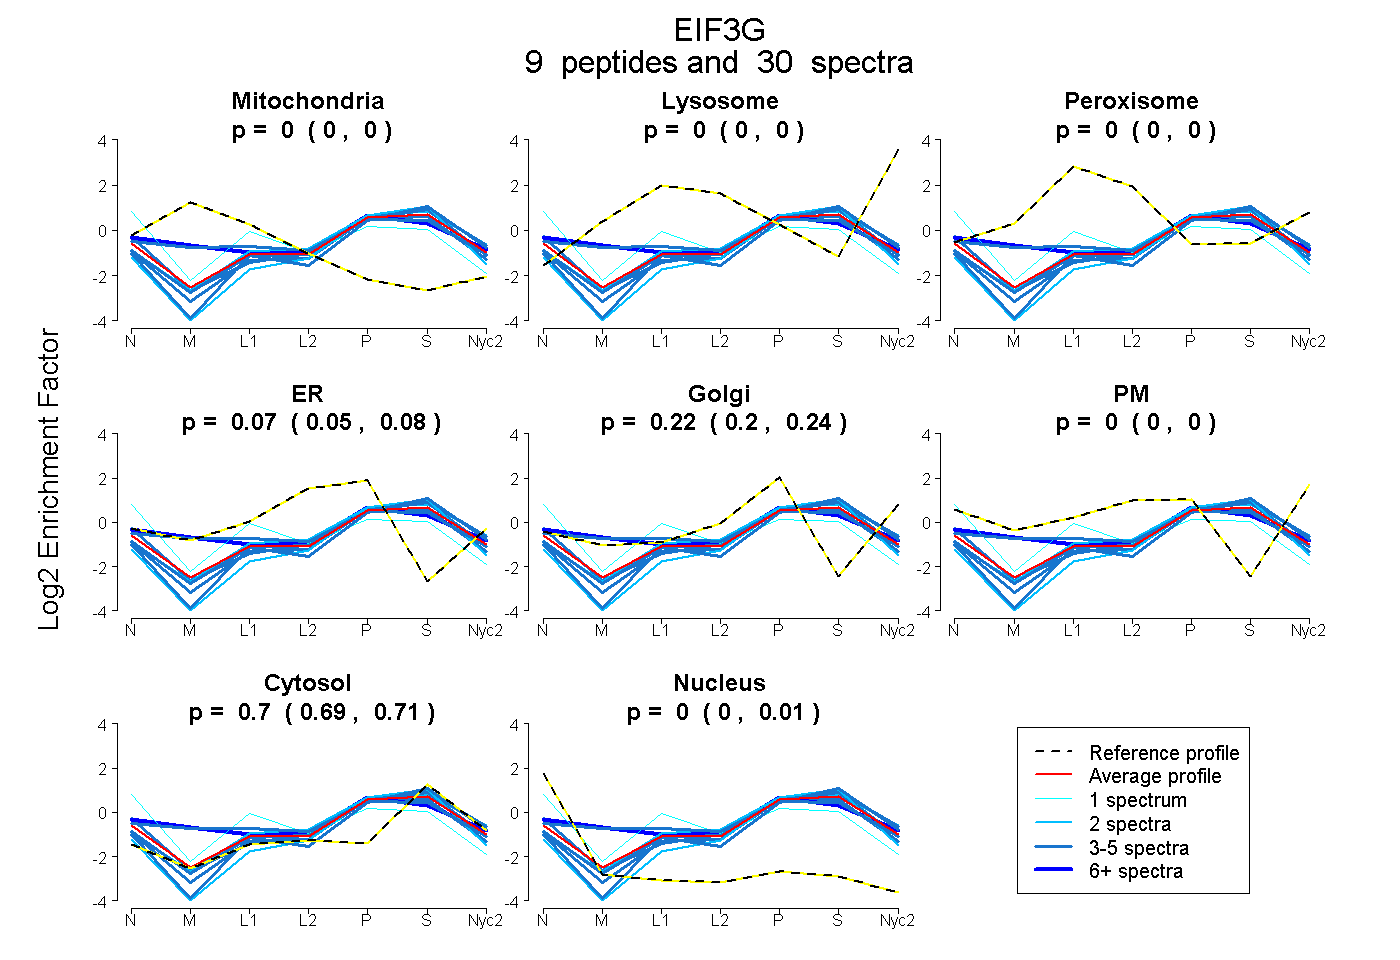
0.000 | 0.000
0.000 | 0.000
0.000 | 0.000
0.054 | 0.085
0.205 | 0.237
0.000 | 0.000
0.691 | 0.712
0.000 | 0.010
6peptides
spectra
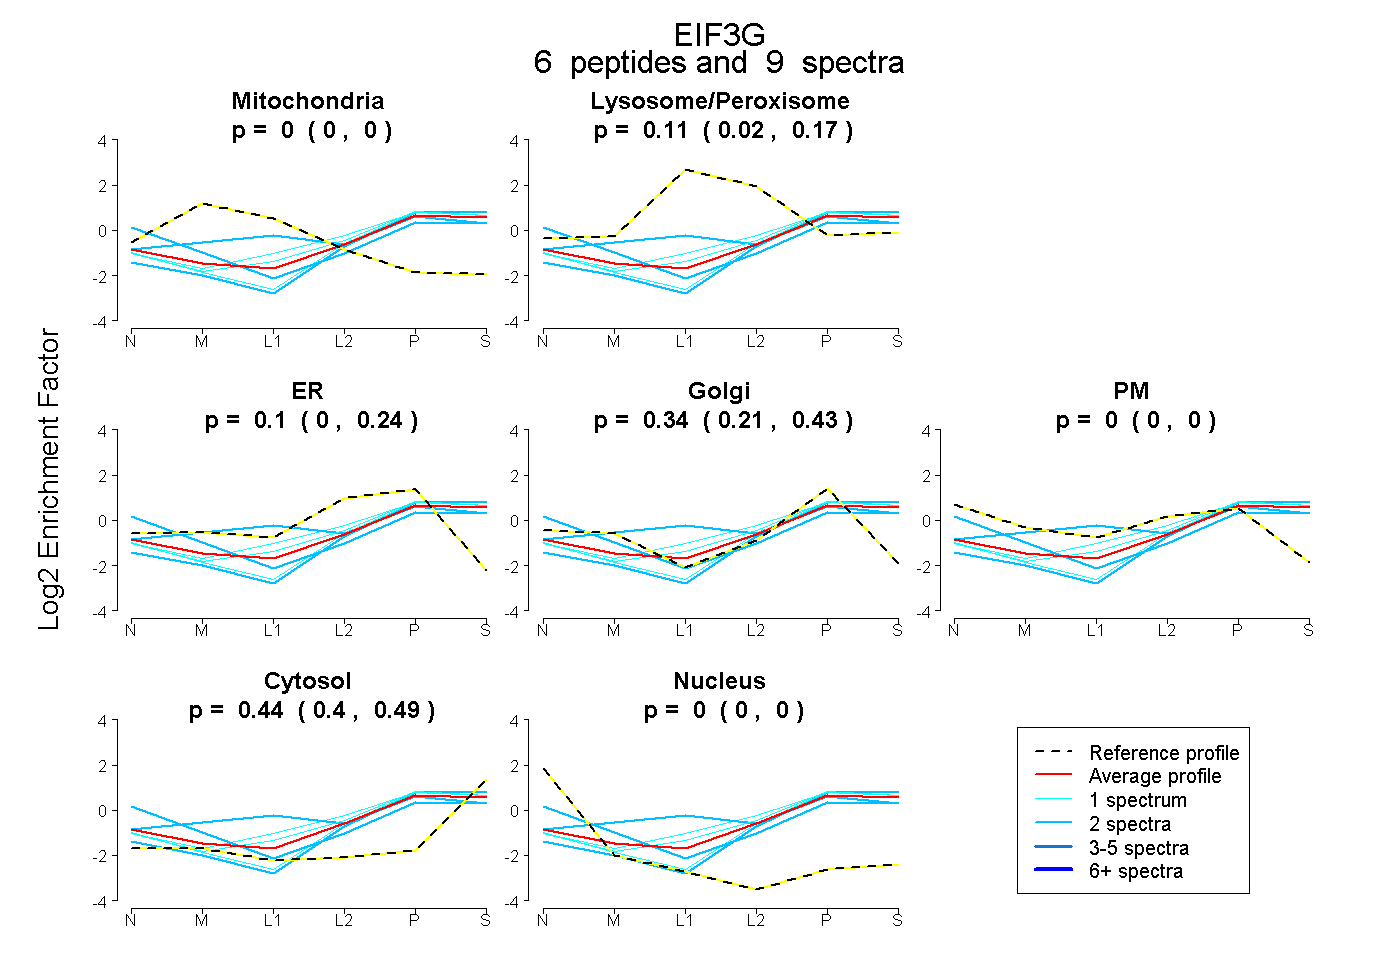
0.000 | 0.000
0.015 | 0.167
0.000 | 0.239
0.211 | 0.429
0.000 | 0.000
0.403 | 0.487
0.000 | 0.000