 9
9peptides
spectra
0.000 | 0.000
0.000 | 0.000
0.000 | 0.000
0.054 | 0.085
0.205 | 0.237
0.000 | 0.000
0.691 | 0.712
0.000 | 0.010
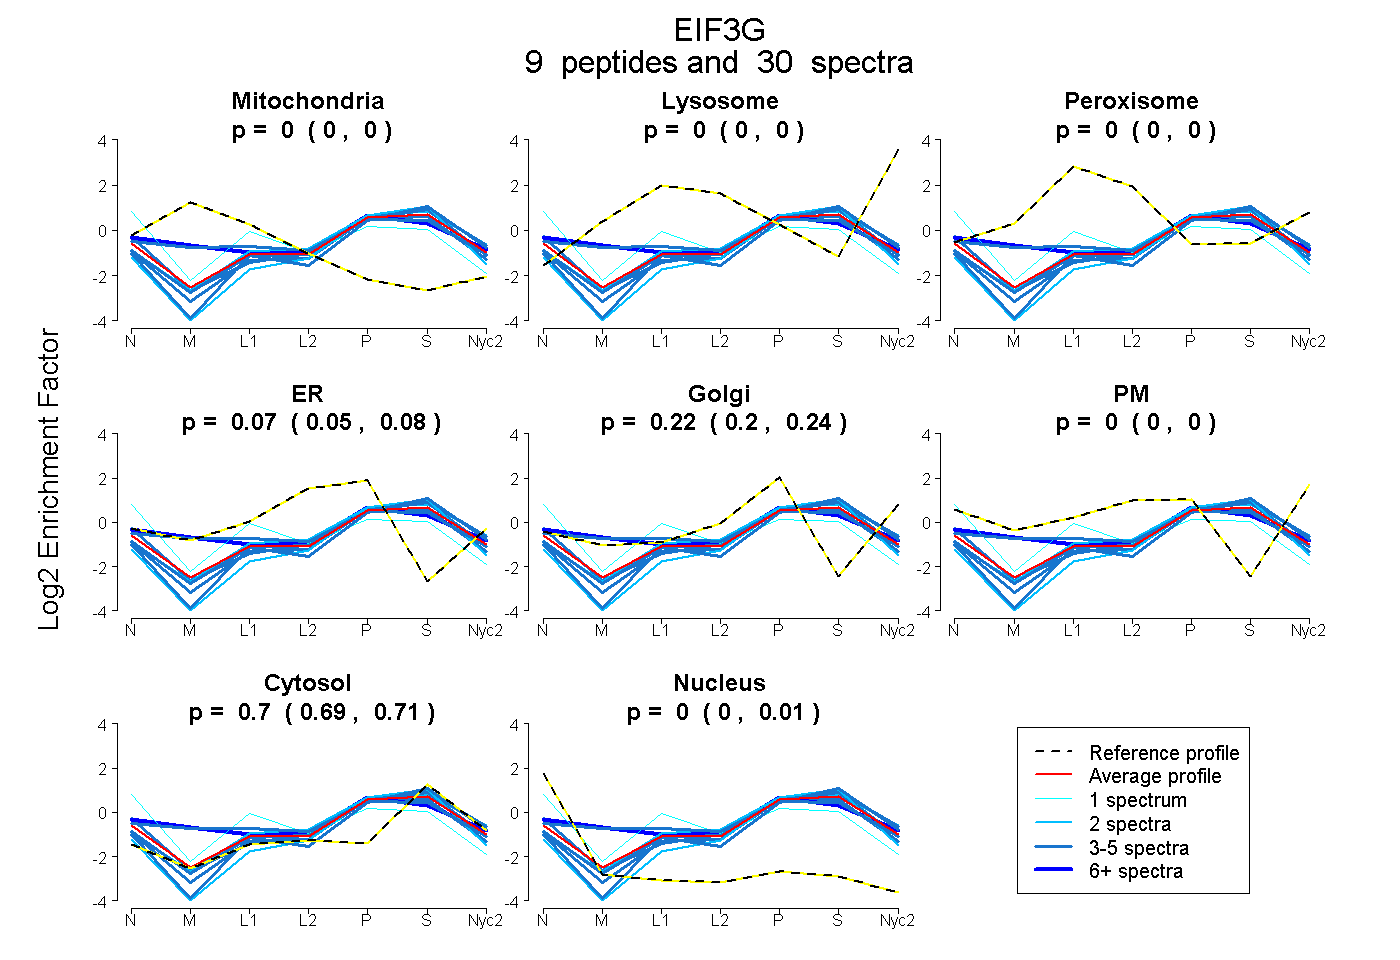
| Plot | Mito | Lyso | Perox | ER | Golgi | PM | Cytosol | Nucleus | |||||
| Expt A |
9 peptides |
30 spectra |
|
0.000 0.000 | 0.000 |
0.000 0.000 | 0.000 |
0.000 0.000 | 0.000 |
0.070 0.054 | 0.085 |
0.223 0.205 | 0.237 |
0.000 0.000 | 0.000 |
0.703 0.691 | 0.712 |
0.004 0.000 | 0.010 |
| 4 spectra, YVPPSLR | 0.000 | 0.000 | 0.000 | 0.000 | 0.162 | 0.000 | 0.838 | 0.000 | ||
| 1 spectrum, GDHWTTR | 0.000 | 0.000 | 0.153 | 0.222 | 0.000 | 0.000 | 0.386 | 0.239 | ||
| 4 spectra, VTNLSEDTR | 0.109 | 0.000 | 0.030 | 0.154 | 0.168 | 0.000 | 0.540 | 0.000 | ||
| 4 spectra, GFAFISFHR | 0.000 | 0.000 | 0.000 | 0.085 | 0.159 | 0.000 | 0.756 | 0.000 | ||
| 2 spectra, LPGELEPVQAAQNK | 0.000 | 0.000 | 0.000 | 0.000 | 0.136 | 0.000 | 0.845 | 0.020 | ||
| 2 spectra, ELAEQLGLSTGEK | 0.000 | 0.000 | 0.000 | 0.080 | 0.225 | 0.000 | 0.694 | 0.000 | ||
| 3 spectra, ADDNATIR | 0.000 | 0.000 | 0.000 | 0.113 | 0.160 | 0.000 | 0.654 | 0.073 | ||
| 6 spectra, DTLGPMQK | 0.108 | 0.000 | 0.010 | 0.051 | 0.341 | 0.000 | 0.489 | 0.000 | ||
| 4 spectra, ETDLQELFRPFGSISR | 0.000 | 0.000 | 0.000 | 0.000 | 0.238 | 0.000 | 0.762 | 0.000 |
| Plot | Mito | Lyso or Perox | ER | Golgi | PM | Cytosol | Nucleus | ||||||
| Expt B |
6 peptides |
9 spectra |
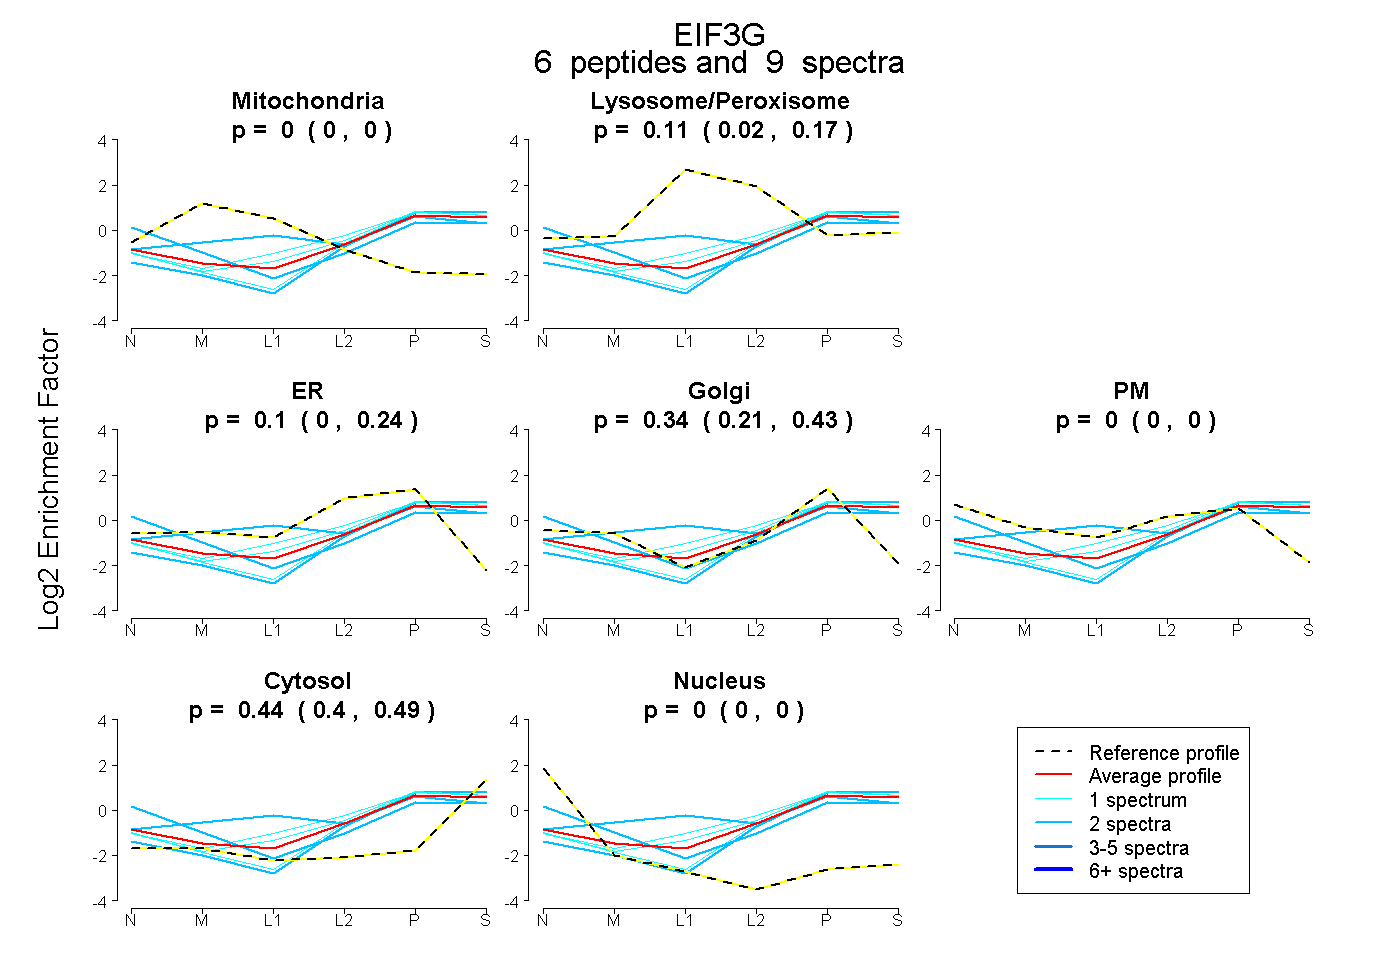 |
0.000 0.000 | 0.000 |
0.107 0.015 | 0.167 |
0.105 0.000 | 0.239 |
0.344 0.211 | 0.429 |
0.000 0.000 | 0.000 |
0.444 0.403 | 0.487 |
0.000 0.000 | 0.000 |
|||
| Plot | Lyso | Other | |||||||||||
| Expt C |
6 peptides |
23 spectra |
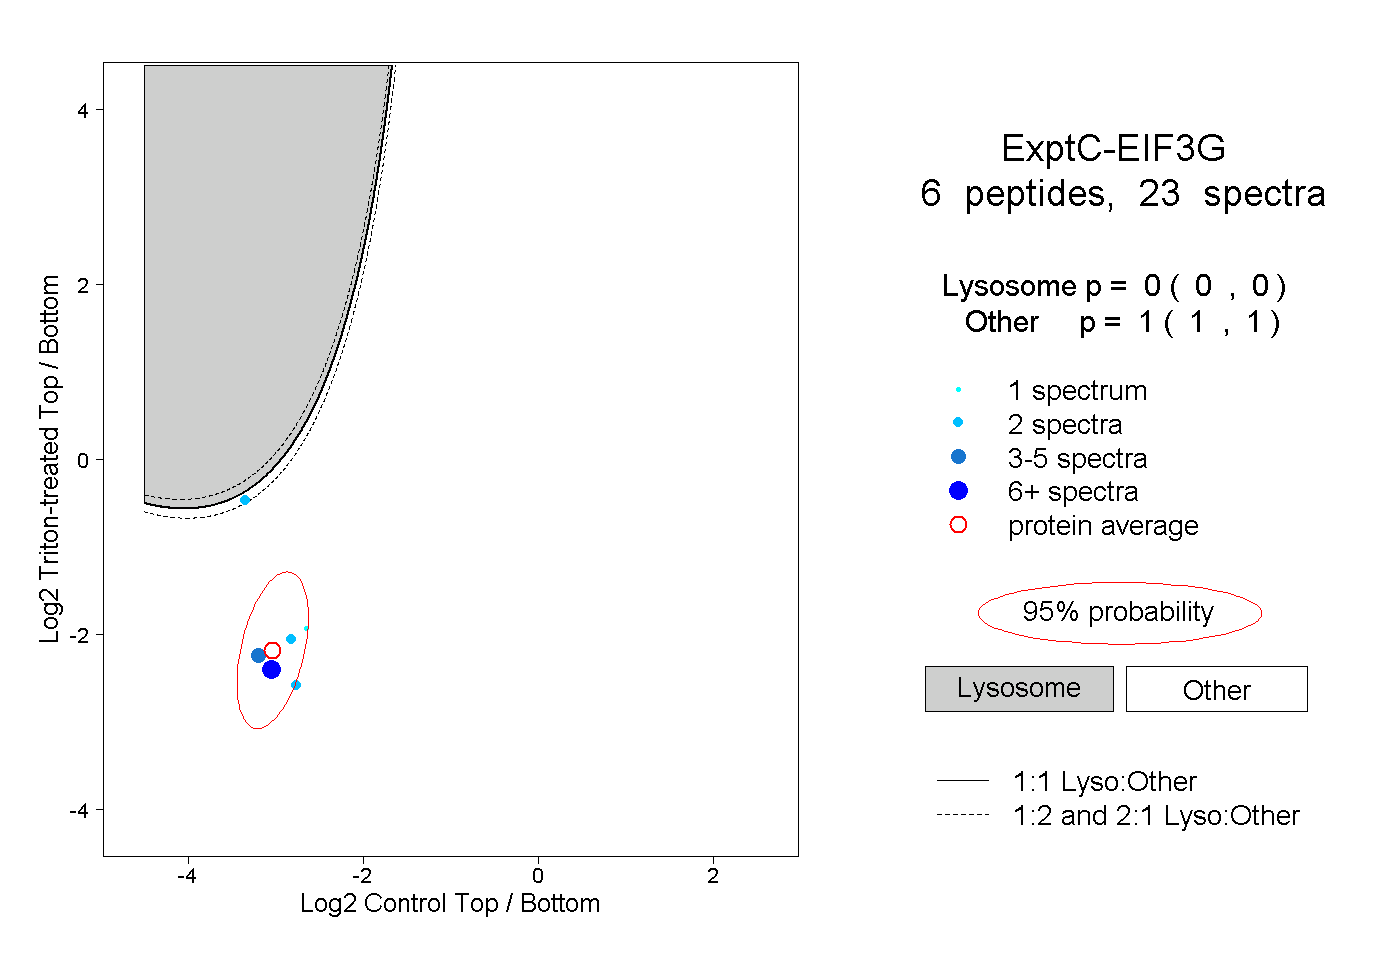 |
0.000 0.000 | 0.000 |
1.000 1.000 | 1.000 |
||||||||
| Plot | Lyso | Other | |||||||||||
| Expt D |
2 peptides |
5 spectra |
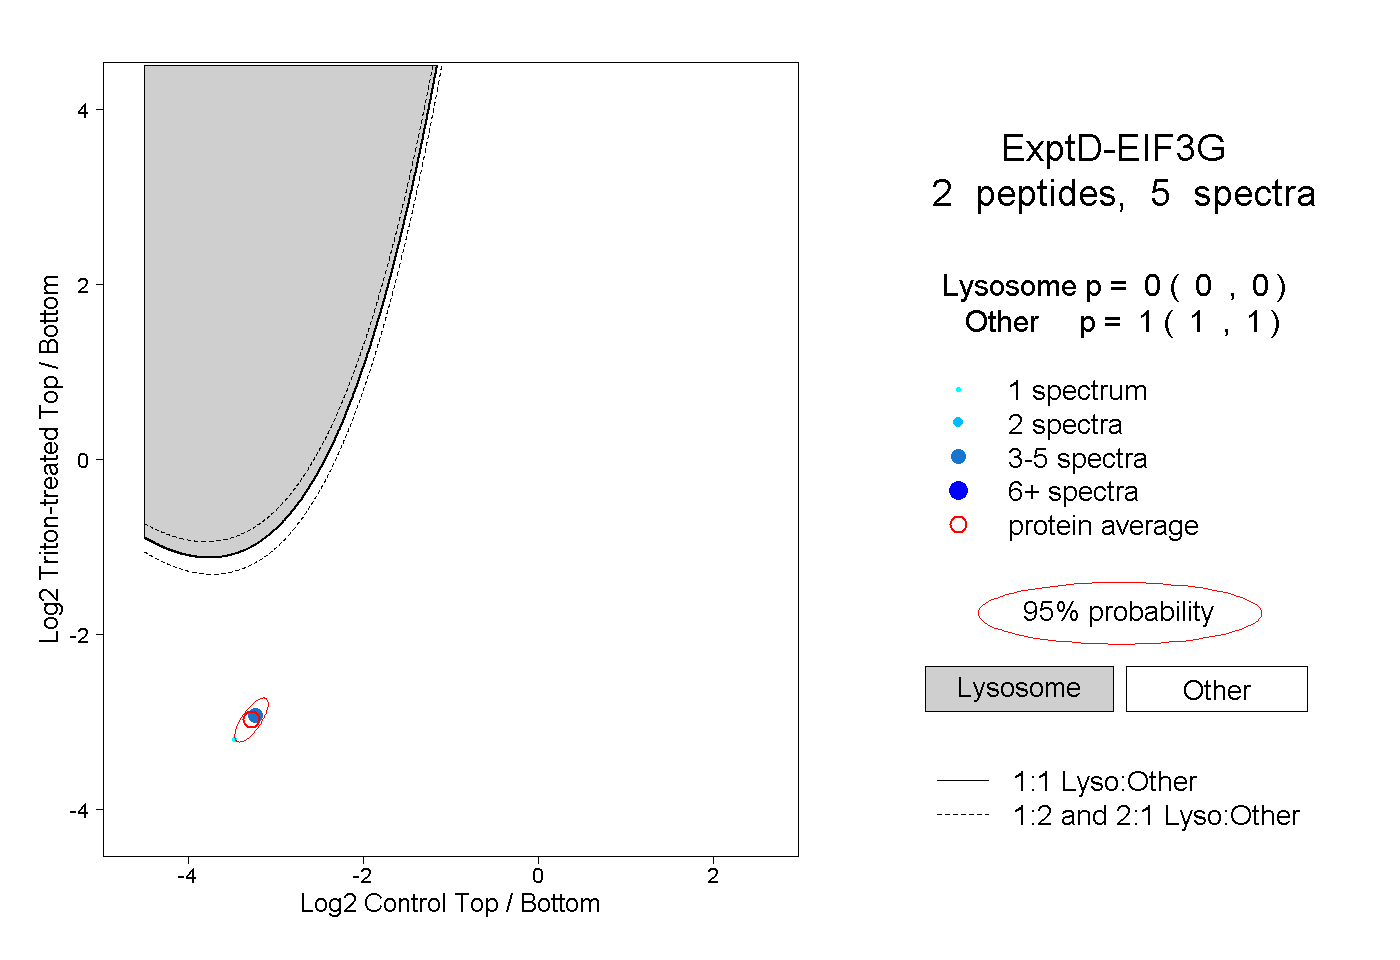 |
0.000 0.000 | 0.000 |
1.000 1.000 | 1.000 |