 3
3peptides
spectra
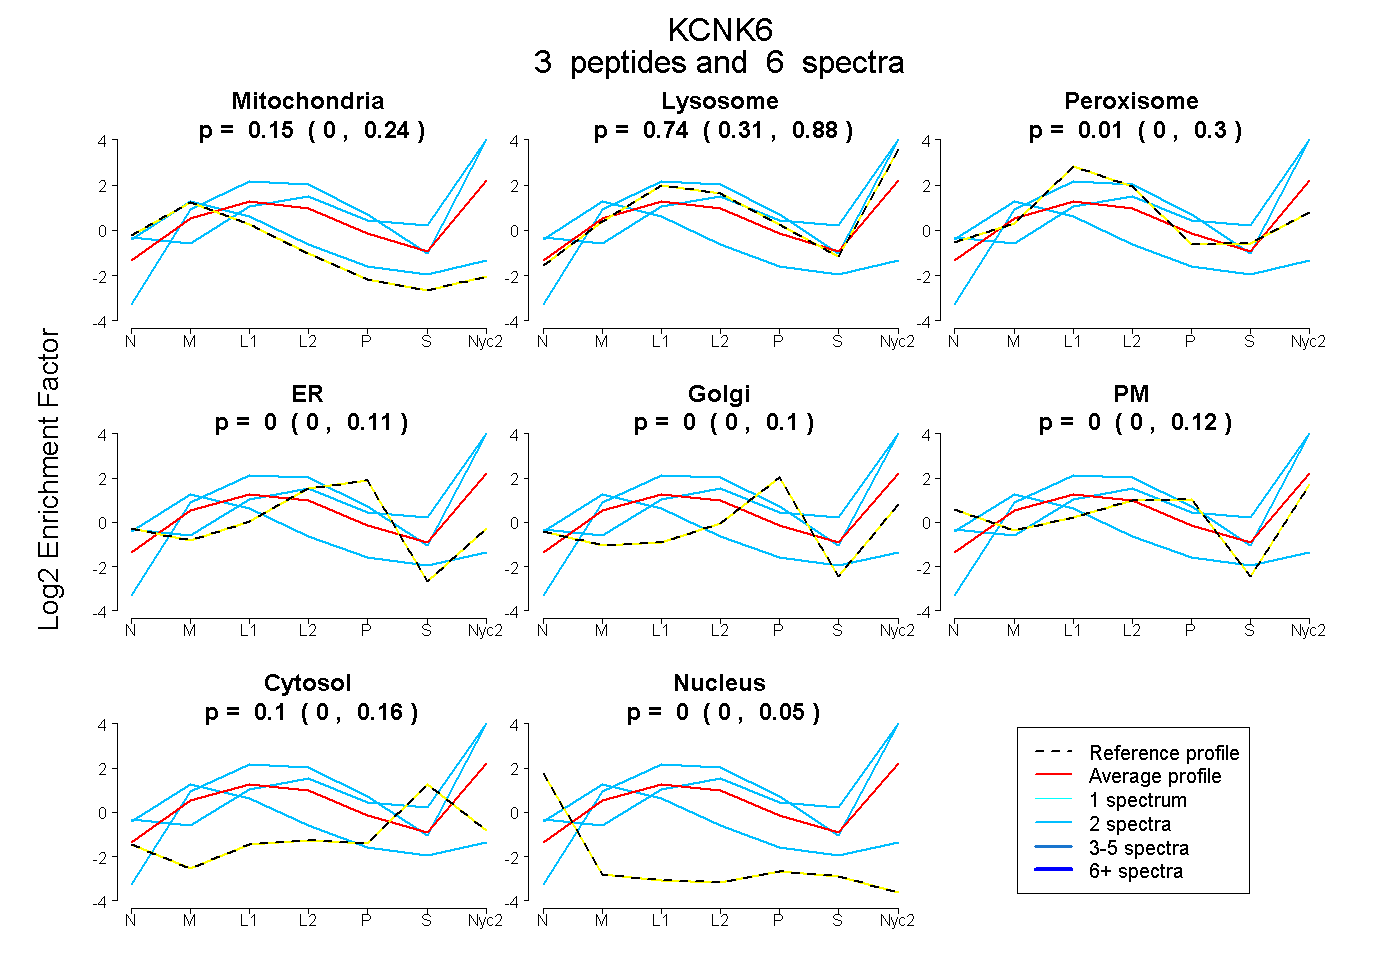
0.000 | 0.238
0.305 | 0.878
0.000 | 0.296
0.000 | 0.110
0.000 | 0.102
0.000 | 0.116
0.000 | 0.164
0.000 | 0.048
2peptides
spectra
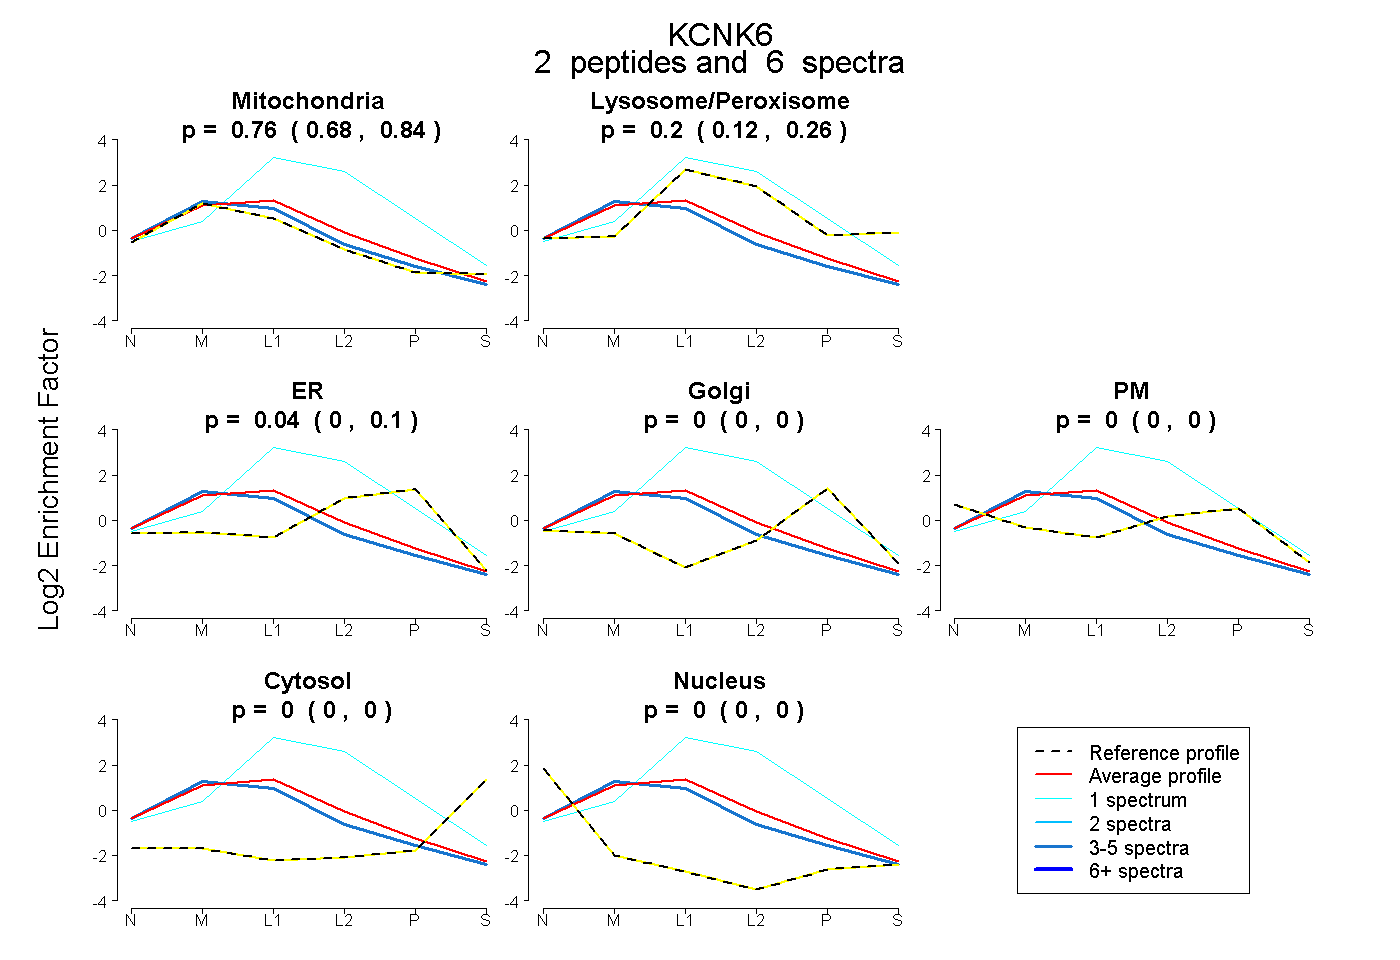
0.676 | 0.836
0.118 | 0.256
0.000 | 0.105
0.000 | 0.000
0.000 | 0.000
0.000 | 0.000
0.000 | 0.000
4peptides
spectra
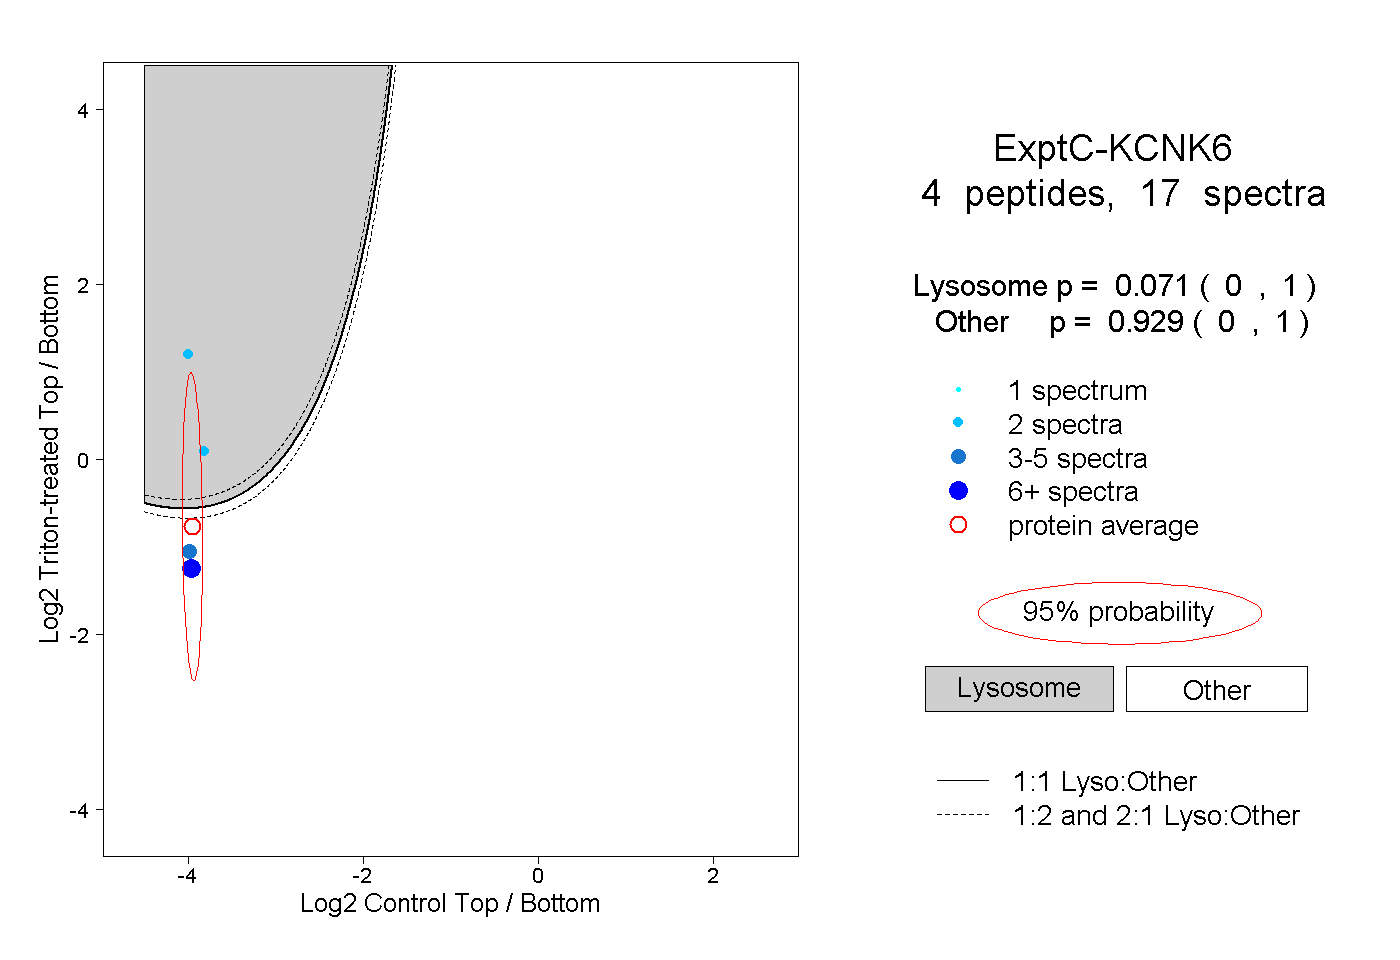
0.000 | 1.000
0.000 | 1.000
2peptides
spectra
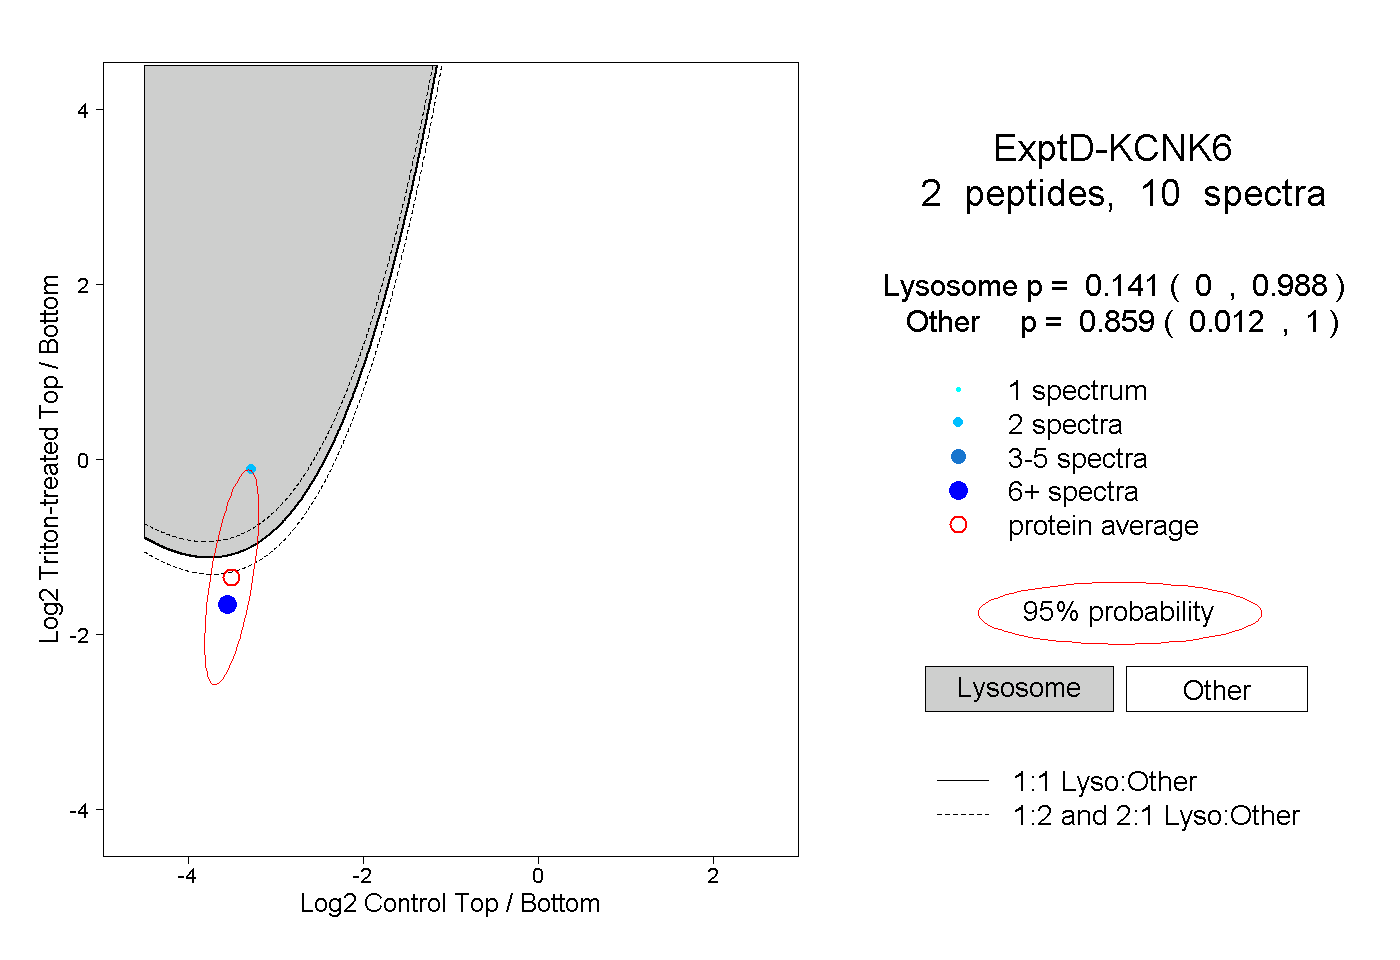
0.000 | 0.988
0.012 | 1.000