5
5peptides
spectra
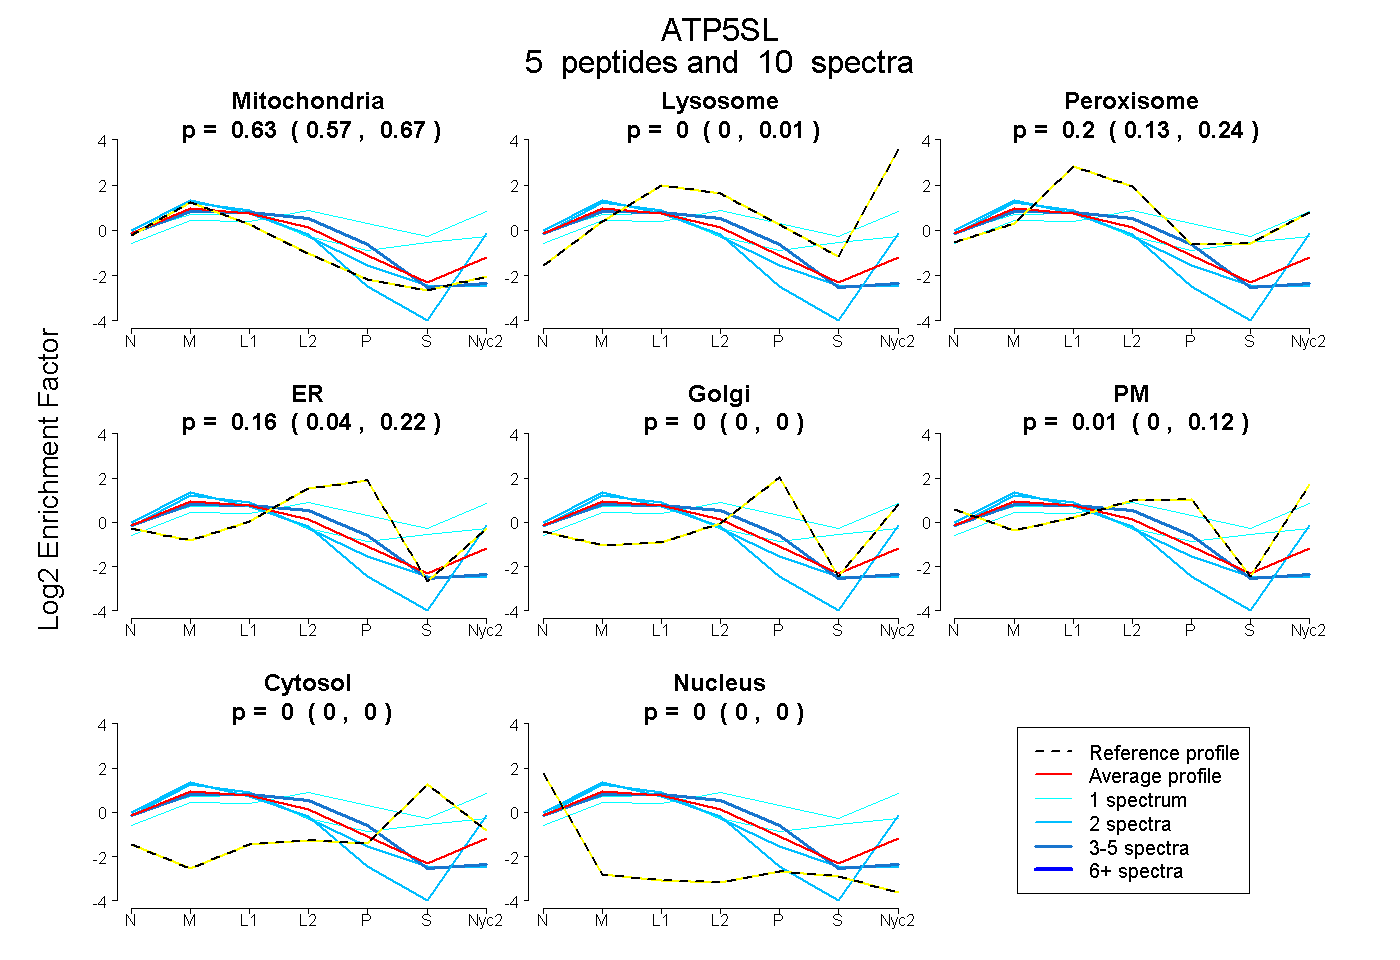
0.569 | 0.673
0.000 | 0.012
0.131 | 0.241
0.042 | 0.223
0.000 | 0.000
0.000 | 0.121
0.000 | 0.000
0.000 | 0.000
2peptides
spectra
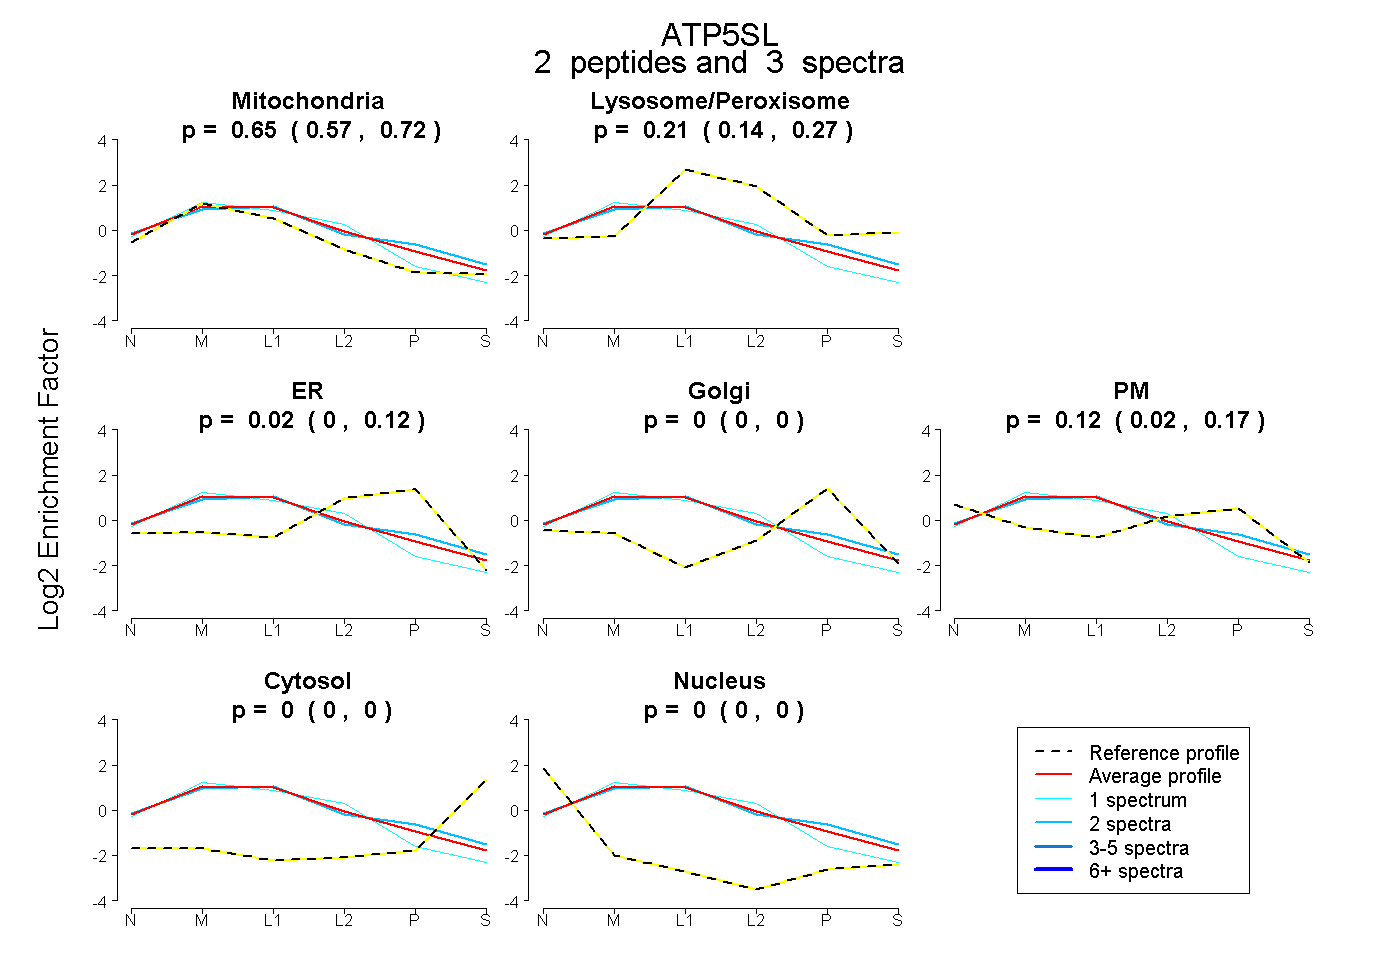
0.566 | 0.724
0.138 | 0.265
0.000 | 0.124
0.000 | 0.000
0.016 | 0.166
0.000 | 0.000
0.000 | 0.000
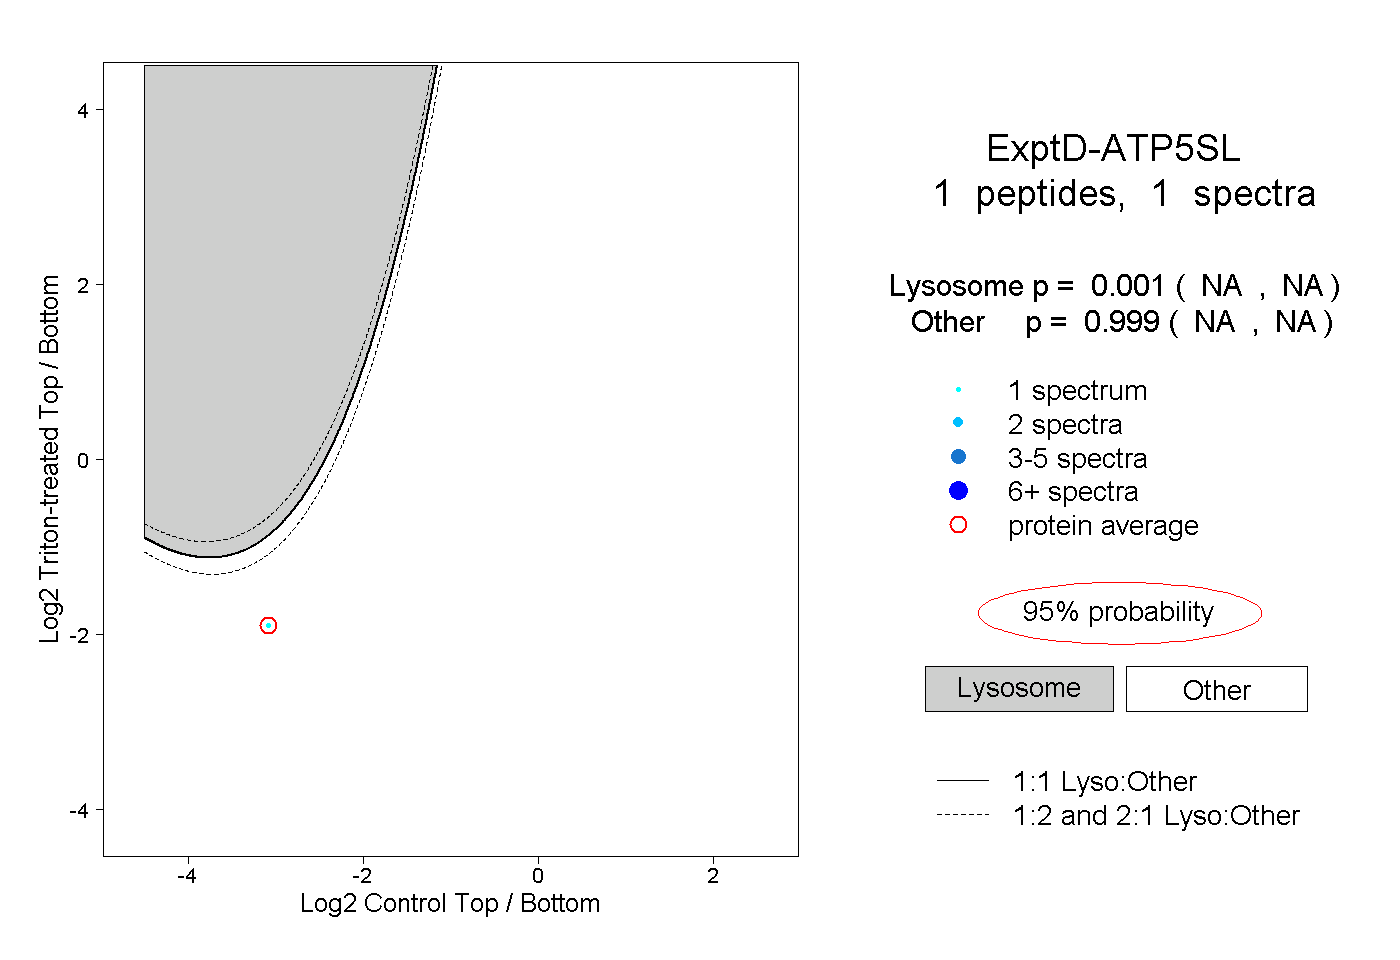
8peptides
spectra
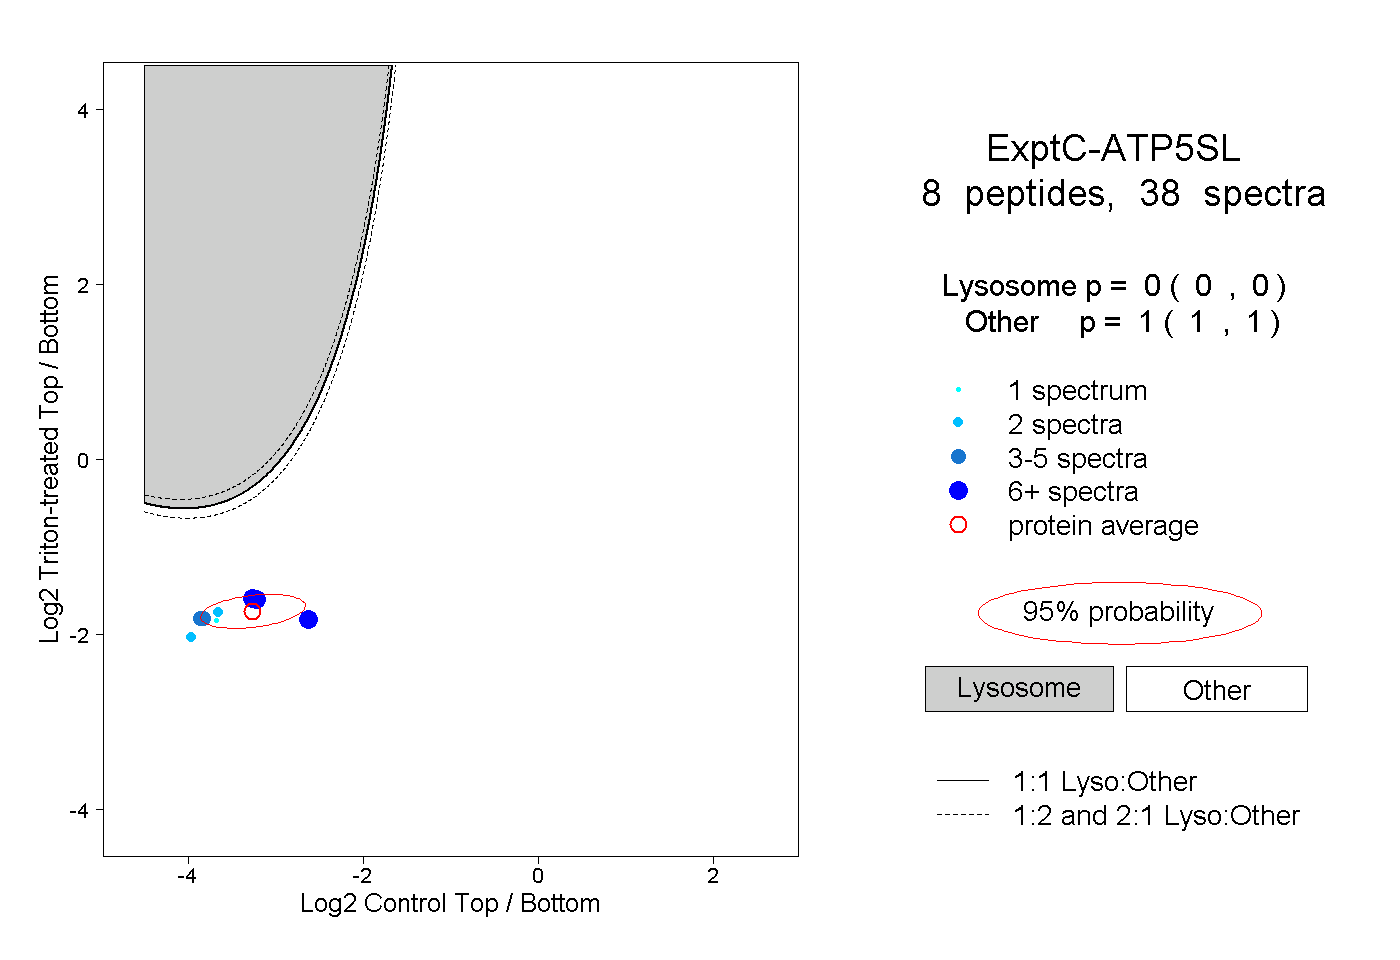
0.000 | 0.000
1.000 | 1.000