 5
5peptides
spectra
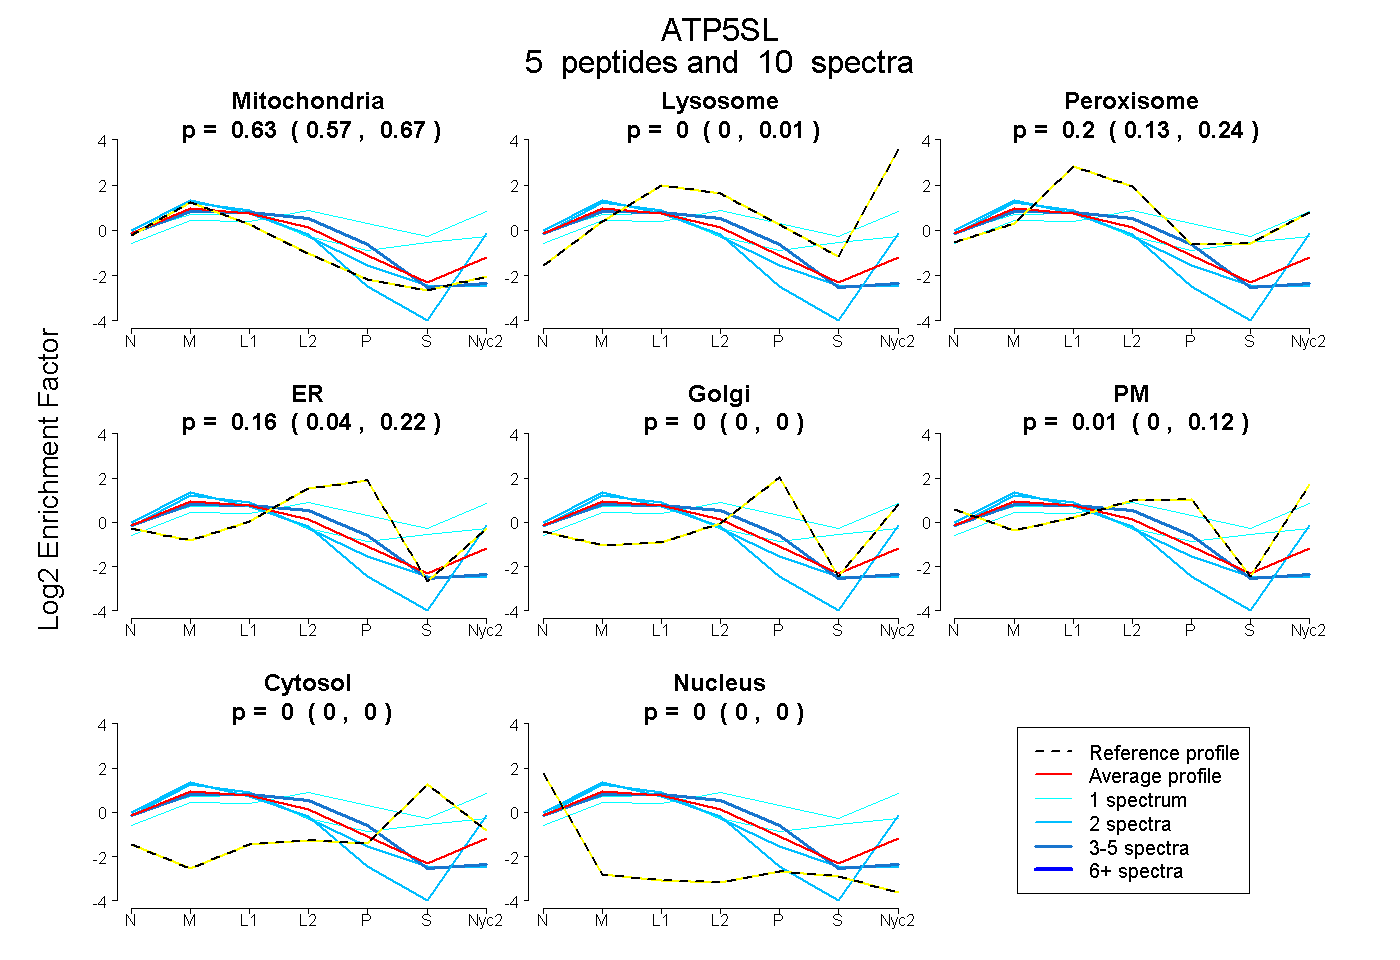
0.569 | 0.673
0.000 | 0.012
0.131 | 0.241
0.042 | 0.223
0.000 | 0.000
0.000 | 0.121
0.000 | 0.000
0.000 | 0.000
| Plot | Mito | Lyso | Perox | ER | Golgi | PM | Cytosol | Nucleus | |||||
| Expt A |
5 peptides |
10 spectra |
|
0.625 0.569 | 0.673 |
0.000 0.000 | 0.012 |
0.200 0.131 | 0.241 |
0.162 0.042 | 0.223 |
0.000 0.000 | 0.000 |
0.013 0.000 | 0.121 |
0.000 0.000 | 0.000 |
0.000 0.000 | 0.000 |
| 2 spectra, LGPDDQPPDTSSPLSS | 0.773 | 0.156 | 0.000 | 0.000 | 0.000 | 0.072 | 0.000 | 0.000 | ||
| 1 spectrum, ELQFLSLQR | 0.050 | 0.180 | 0.334 | 0.000 | 0.201 | 0.060 | 0.174 | 0.000 | ||
| 2 spectra, CPNLDDWCLSR | 0.855 | 0.000 | 0.088 | 0.058 | 0.000 | 0.000 | 0.000 | 0.000 | ||
| 1 spectrum, EYLIAGK | 0.372 | 0.040 | 0.317 | 0.000 | 0.000 | 0.080 | 0.191 | 0.000 | ||
| 4 spectra, GLACLHHLQNLR | 0.634 | 0.000 | 0.058 | 0.308 | 0.000 | 0.000 | 0.000 | 0.000 |
| Plot | Mito | Lyso or Perox | ER | Golgi | PM | Cytosol | Nucleus | ||||||
| Expt B |
2 peptides |
3 spectra |
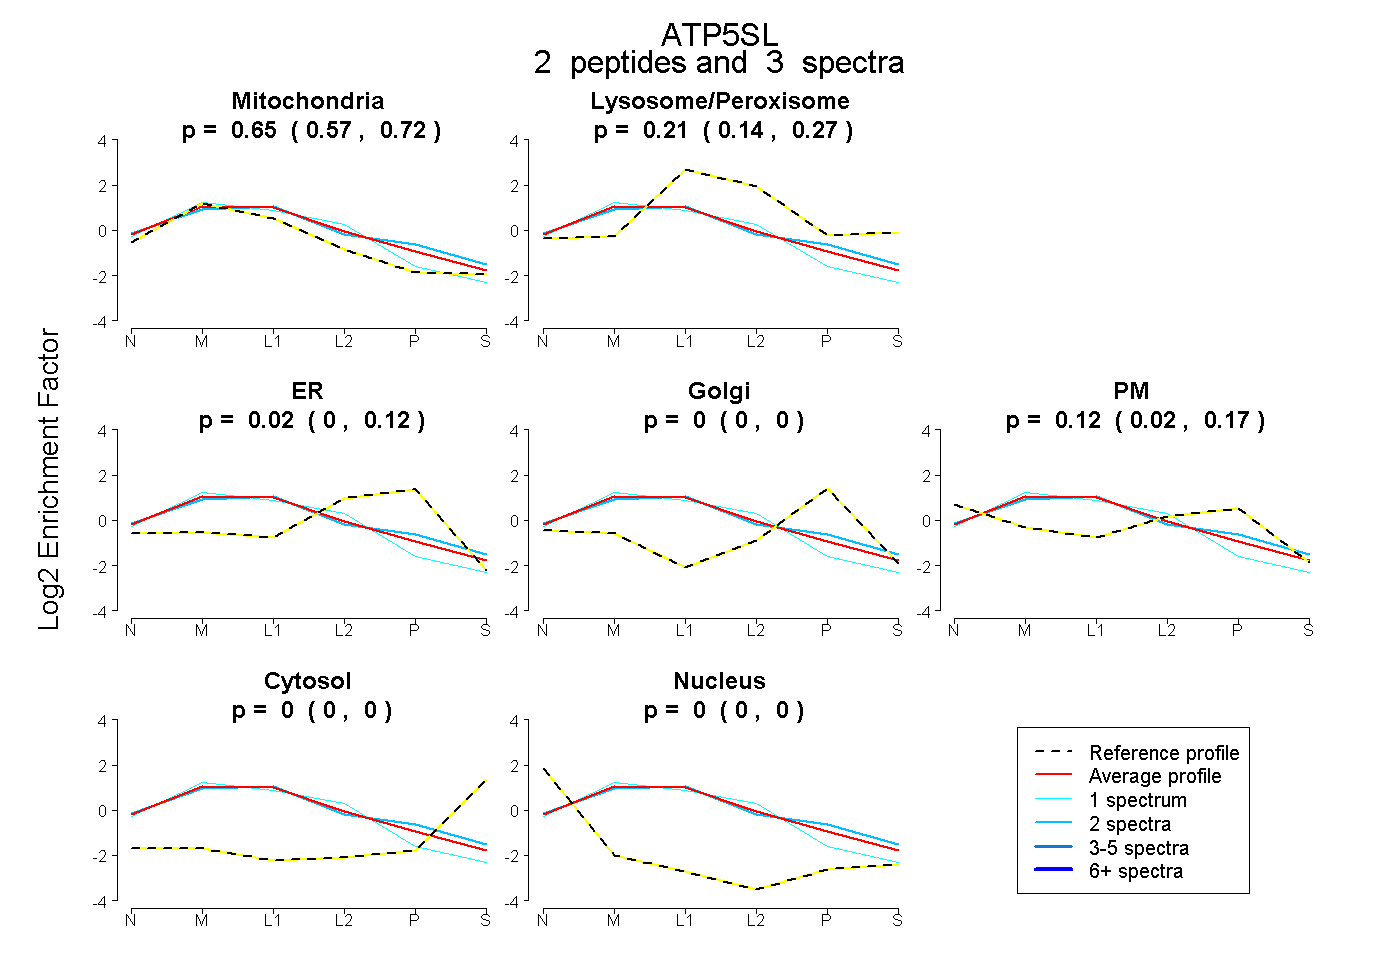 |
0.649 0.566 | 0.724 |
0.211 0.138 | 0.265 |
0.022 0.000 | 0.124 |
0.000 0.000 | 0.000 |
0.118 0.016 | 0.166 |
0.000 0.000 | 0.000 |
0.000 0.000 | 0.000 |
|||
| Plot | Lyso | Other | |||||||||||
| Expt C |
8 peptides |
38 spectra |
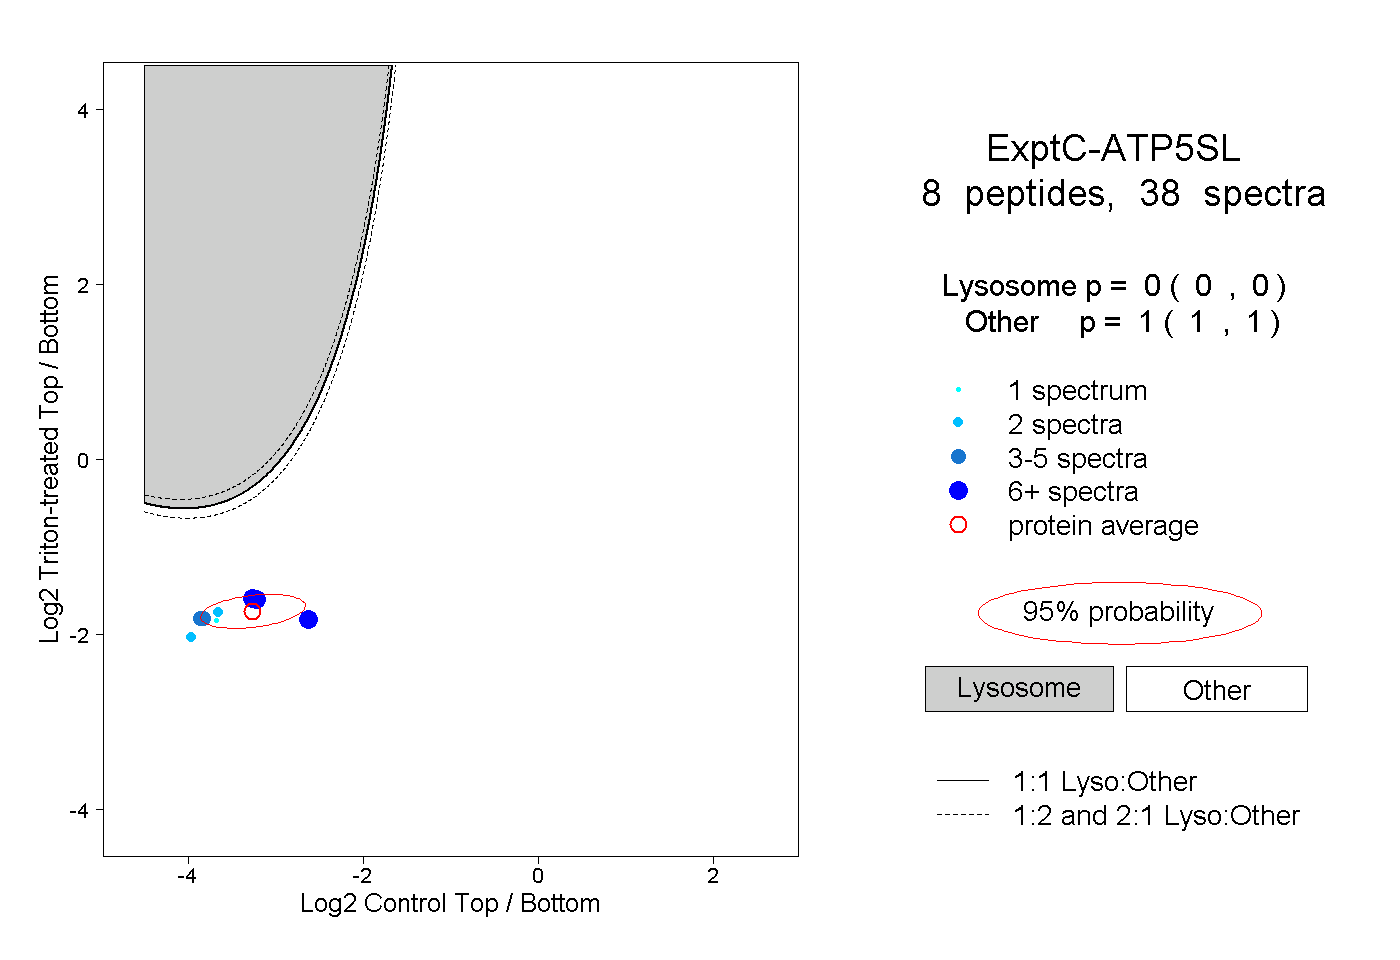 |
0.000 0.000 | 0.000 |
1.000 1.000 | 1.000 |
||||||||
| Plot | Lyso | Other | |||||||||||
| Expt D |
1 peptide |
1 spectrum |
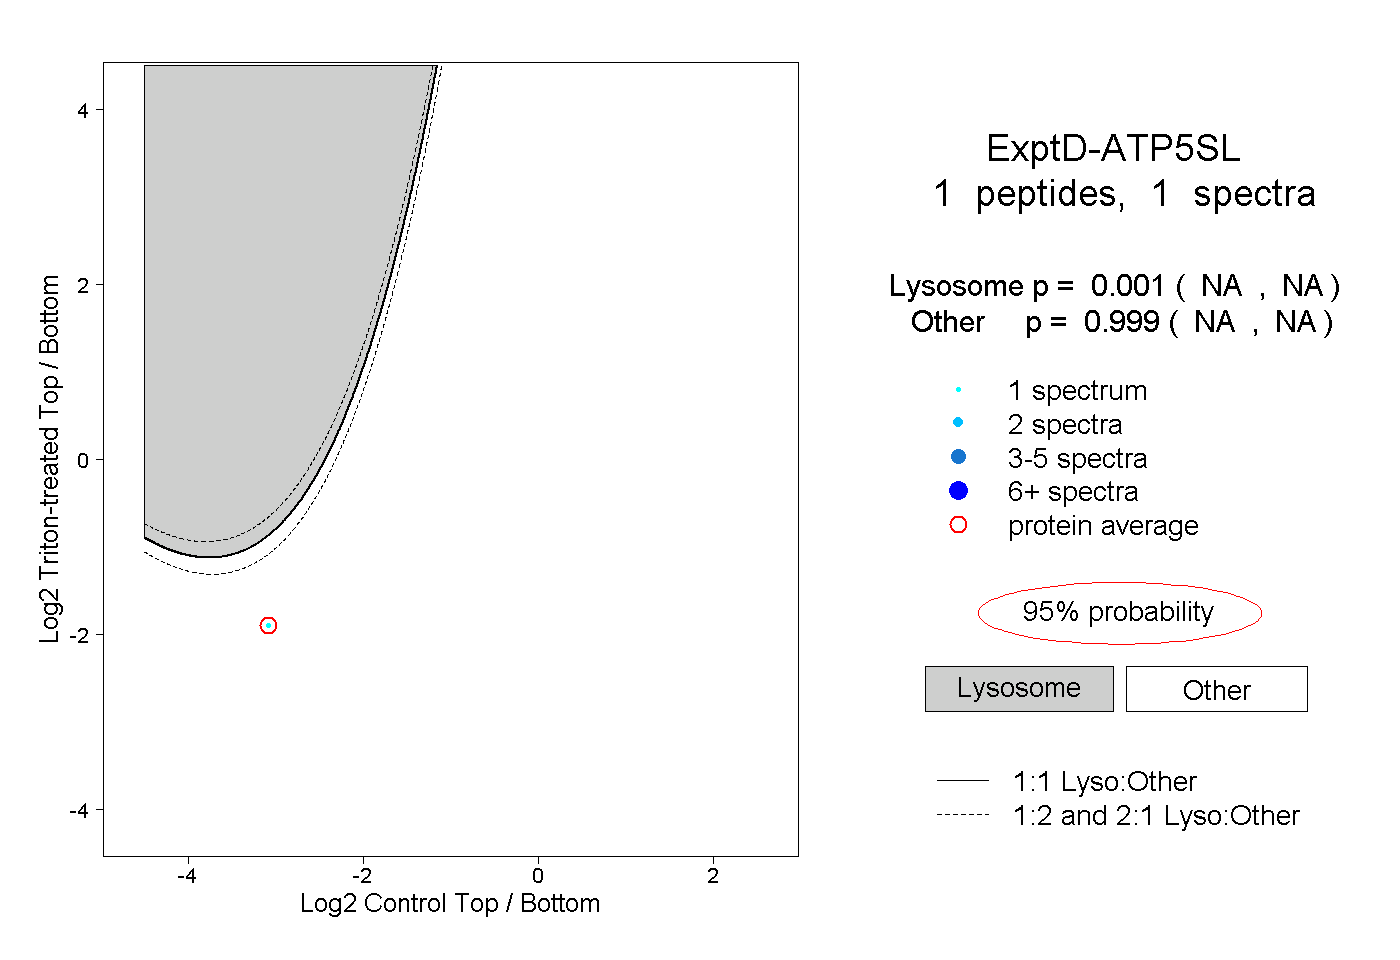 |
0.001 NA | NA |
0.999 NA | NA |