 4
4peptides
spectra
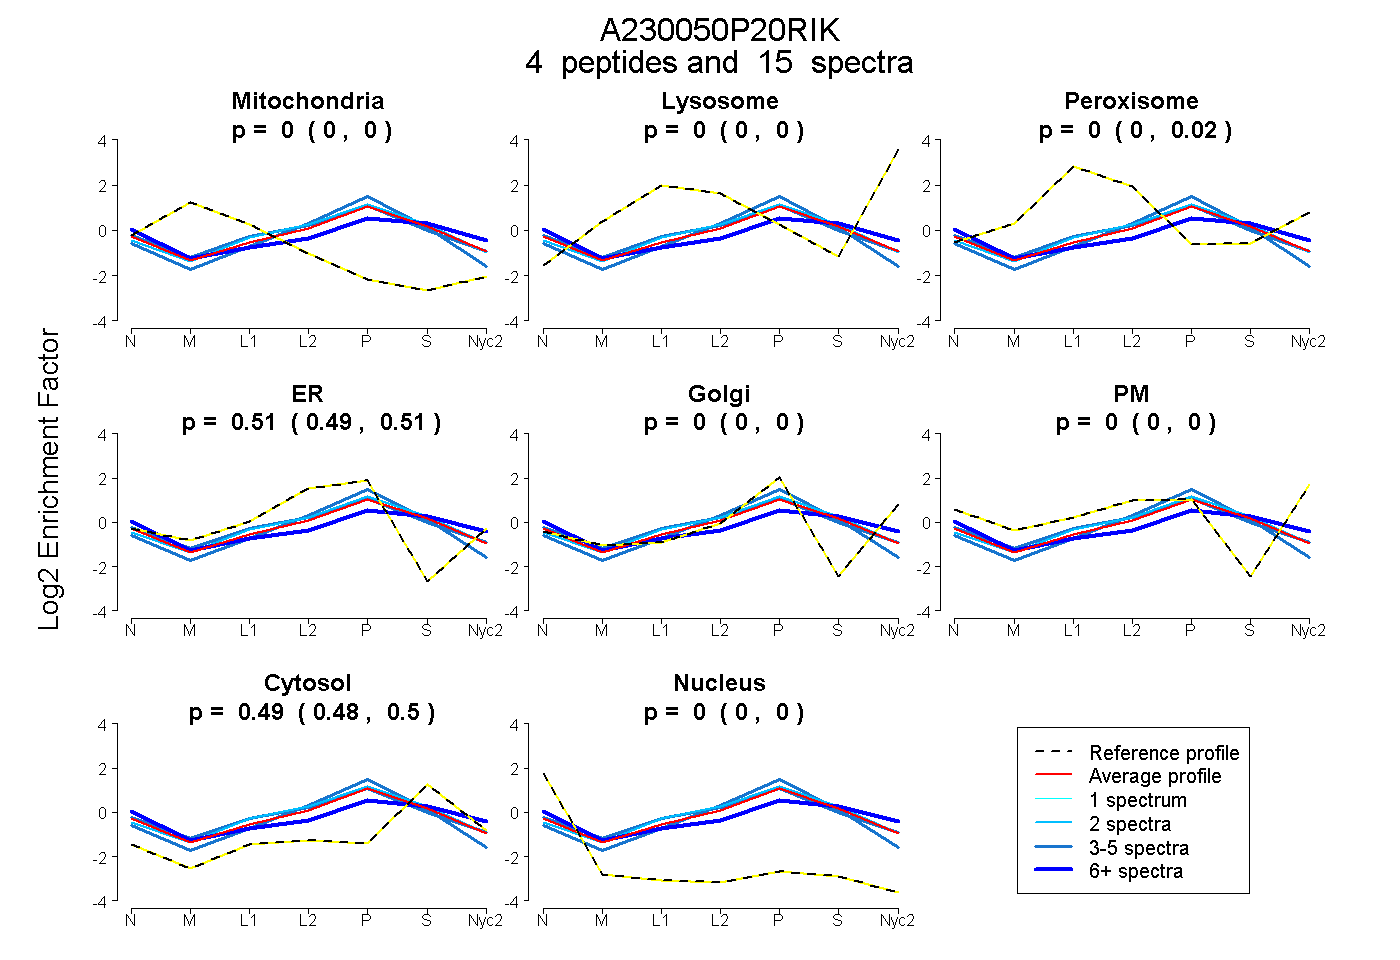
0.000 | 0.000
0.000 | 0.000
0.000 | 0.018
0.486 | 0.515
0.000 | 0.000
0.000 | 0.000
0.480 | 0.502
0.000 | 0.000
1peptide
spectrum
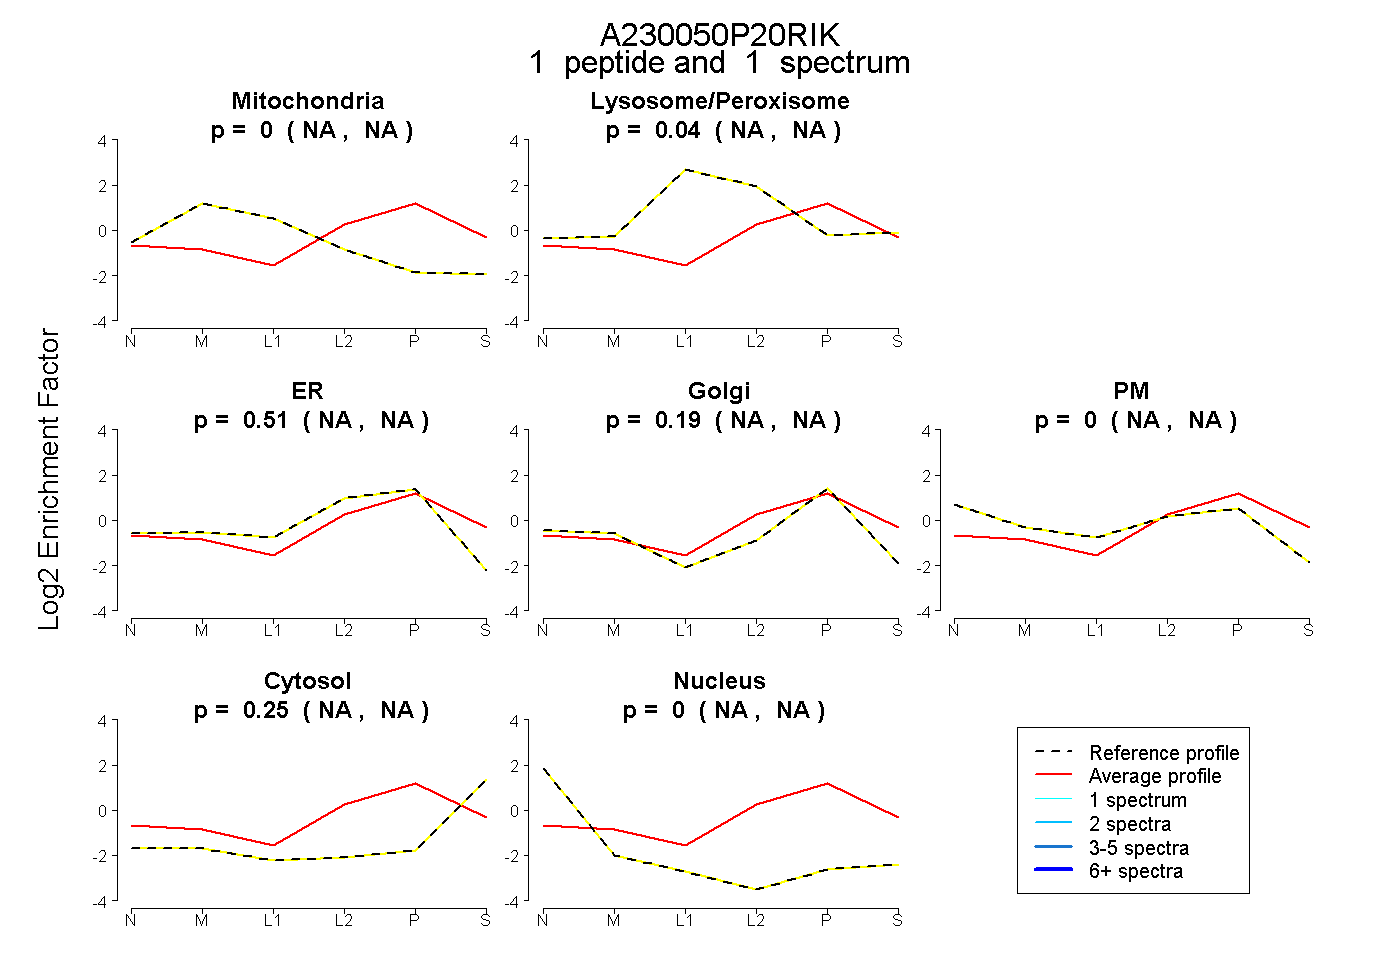
NA | NA
NA | NA
NA | NA
NA | NA
NA | NA
NA | NA
NA | NA
3peptides
spectra
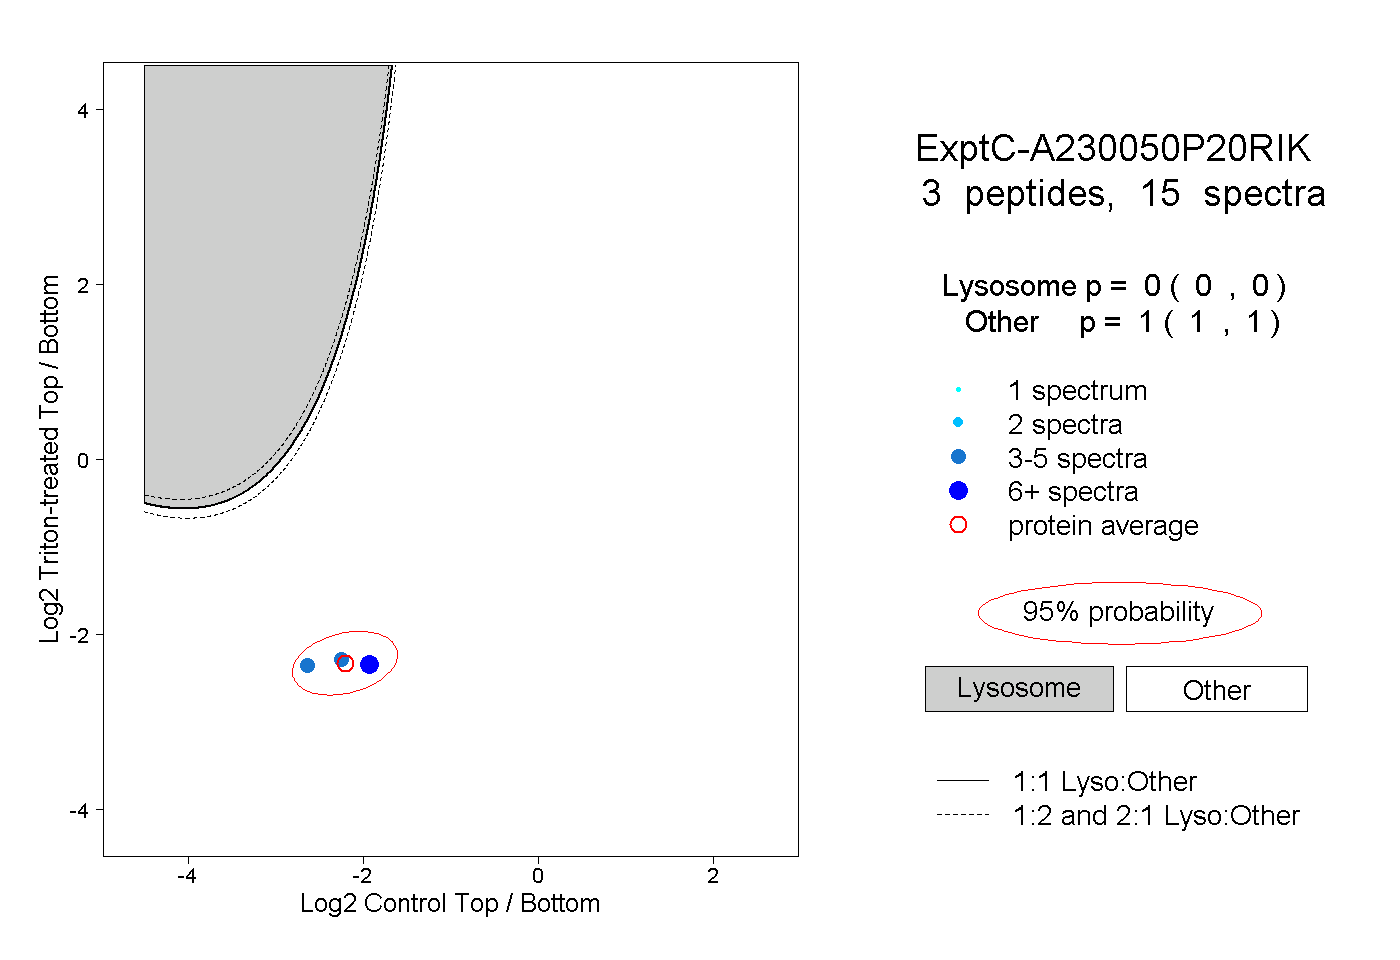
0.000 | 0.000
1.000 | 1.000