 1
1peptide
spectra
0.000 | 0.000
0.000 | 0.000
0.000 | 0.000
0.001 | 0.130
0.000 | 0.000
0.000 | 0.000
0.005 | 0.161
0.776 | 0.885
2peptides
spectra
NA | NA
NA | NA
NA | NA
NA | NA
NA | NA
NA | NA
NA | NA
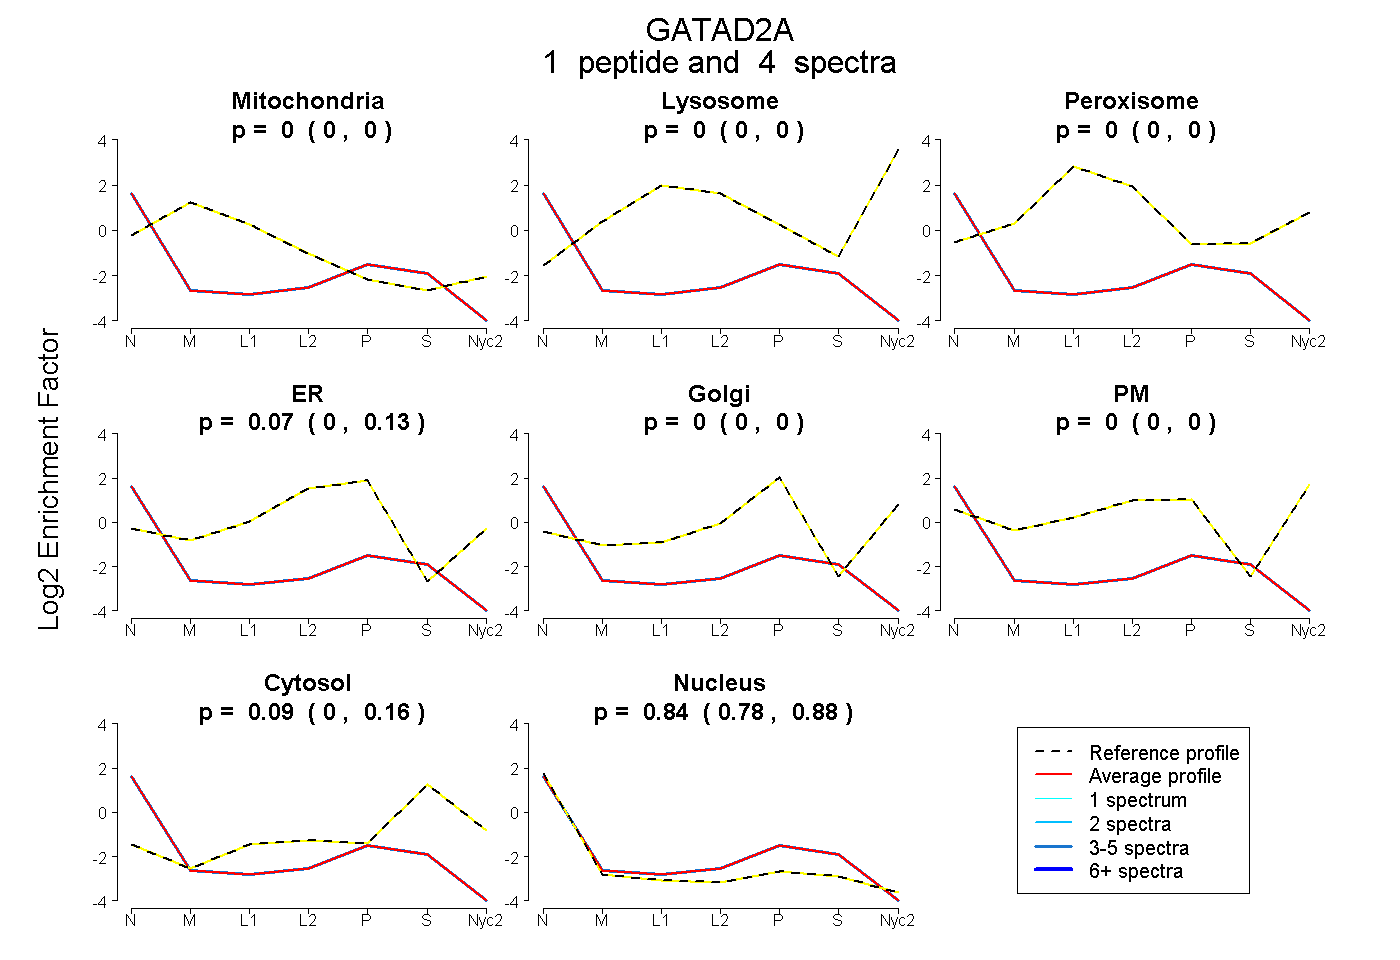
| Plot | Mito | Lyso | Perox | ER | Golgi | PM | Cytosol | Nucleus | |||||
| Expt A |
1 peptide |
4 spectra |
|
0.000 0.000 | 0.000 |
0.000 0.000 | 0.000 |
0.000 0.000 | 0.000 |
0.072 0.001 | 0.130 |
0.000 0.000 | 0.000 |
0.000 0.000 | 0.000 |
0.093 0.005 | 0.161 |
0.835 0.776 | 0.885 |
||
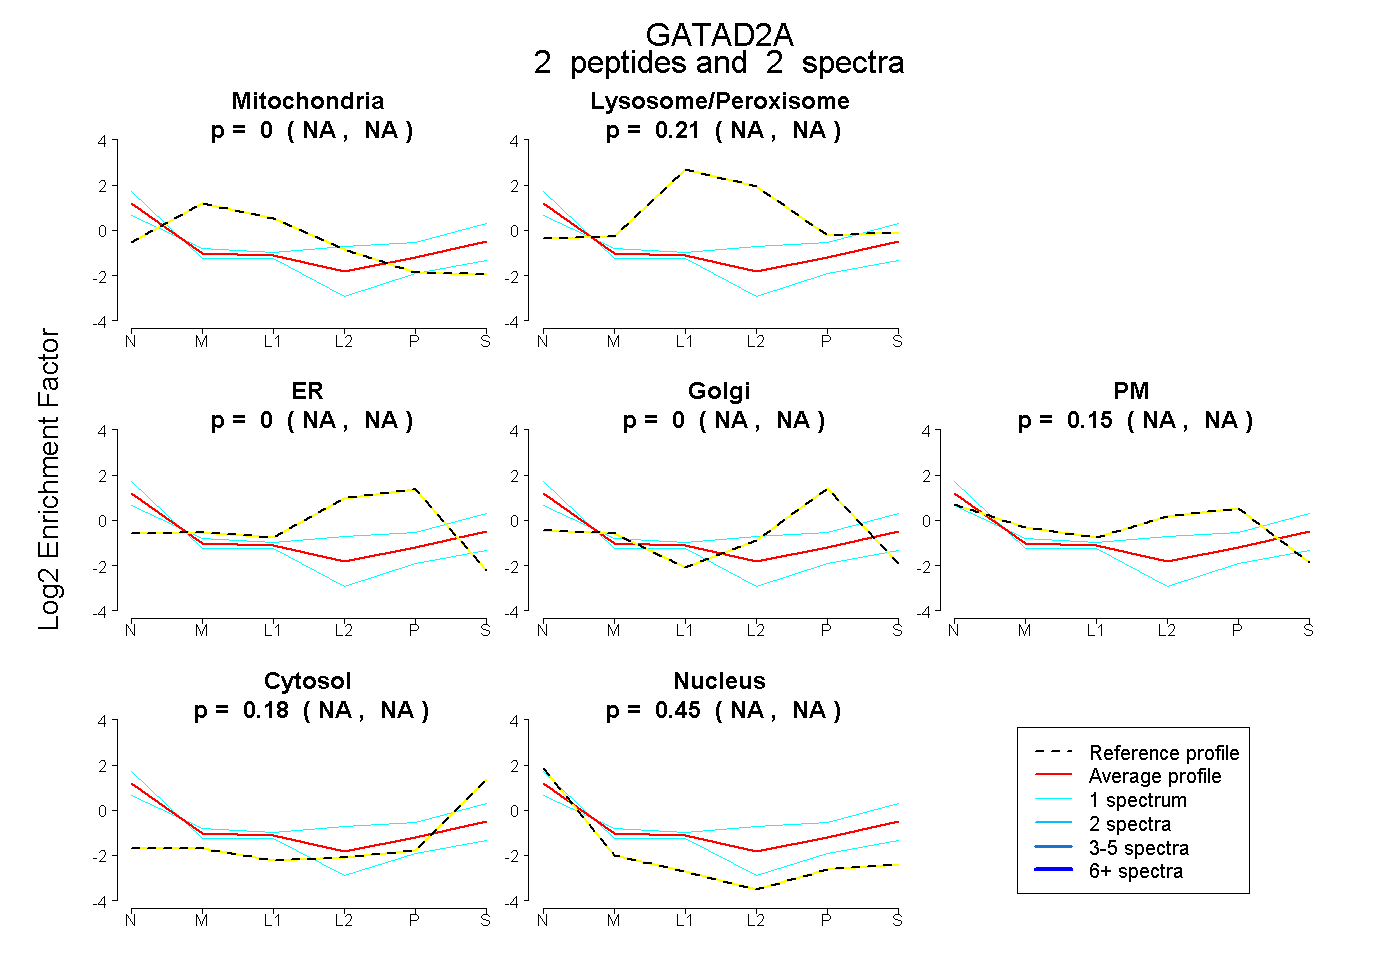
| Plot | Mito | Lyso or Perox | ER | Golgi | PM | Cytosol | Nucleus | ||||||
| Expt B |
2 peptides |
2 spectra |
|
0.000 NA | NA |
0.212 NA | NA |
0.000 NA | NA |
0.000 NA | NA |
0.149 NA | NA |
0.185 NA | NA |
0.455 NA | NA |