 1
1peptide
spectra
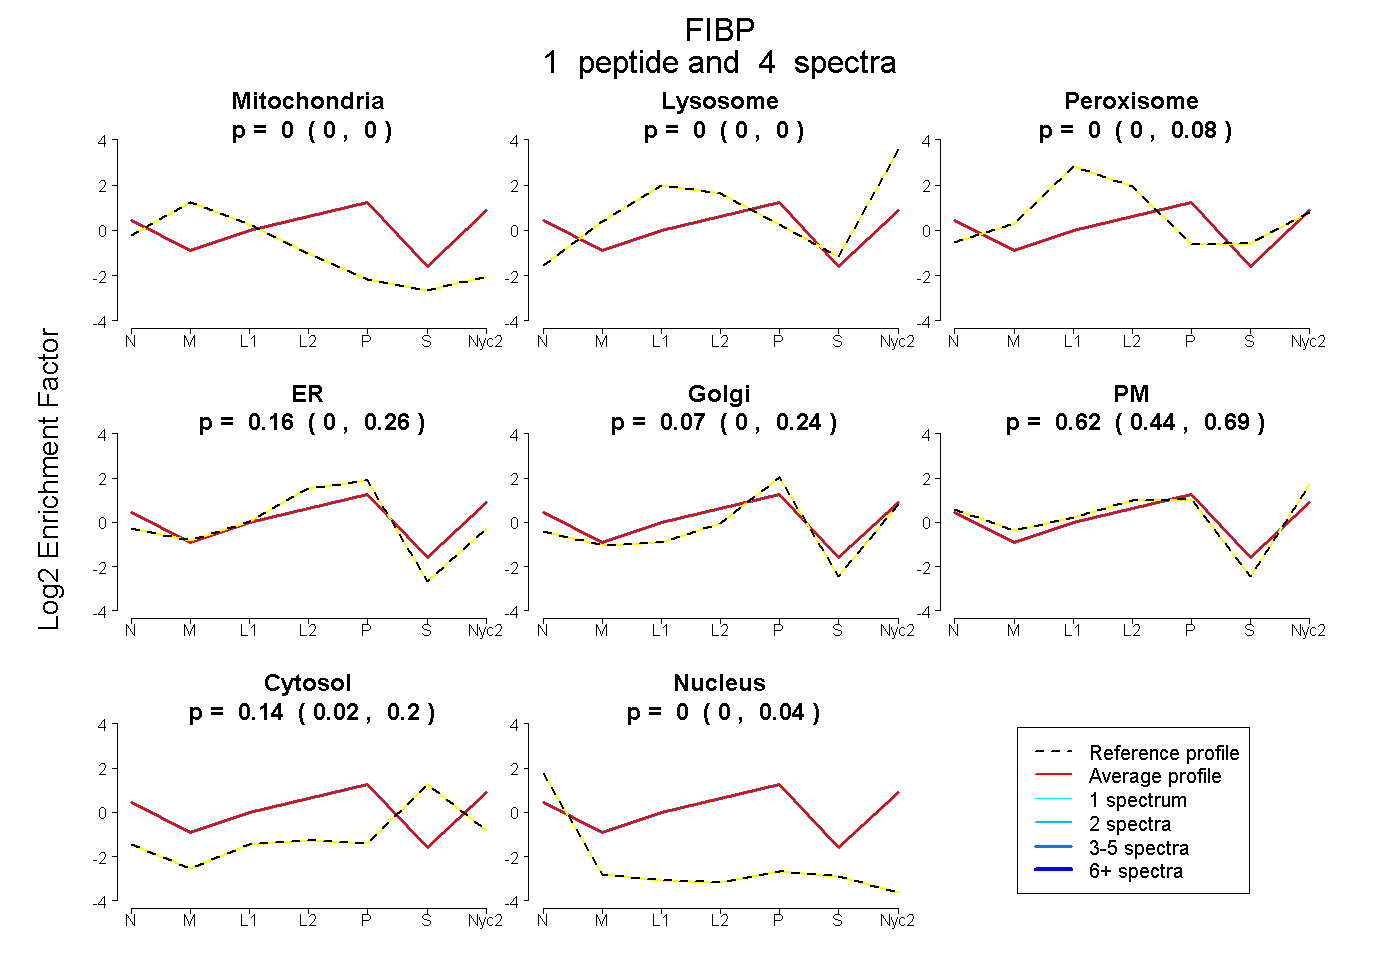
0.000 | 0.000
0.000 | 0.000
0.000 | 0.079
0.000 | 0.258
0.000 | 0.242
0.442 | 0.693
0.017 | 0.201
0.000 | 0.039
1peptide
spectra
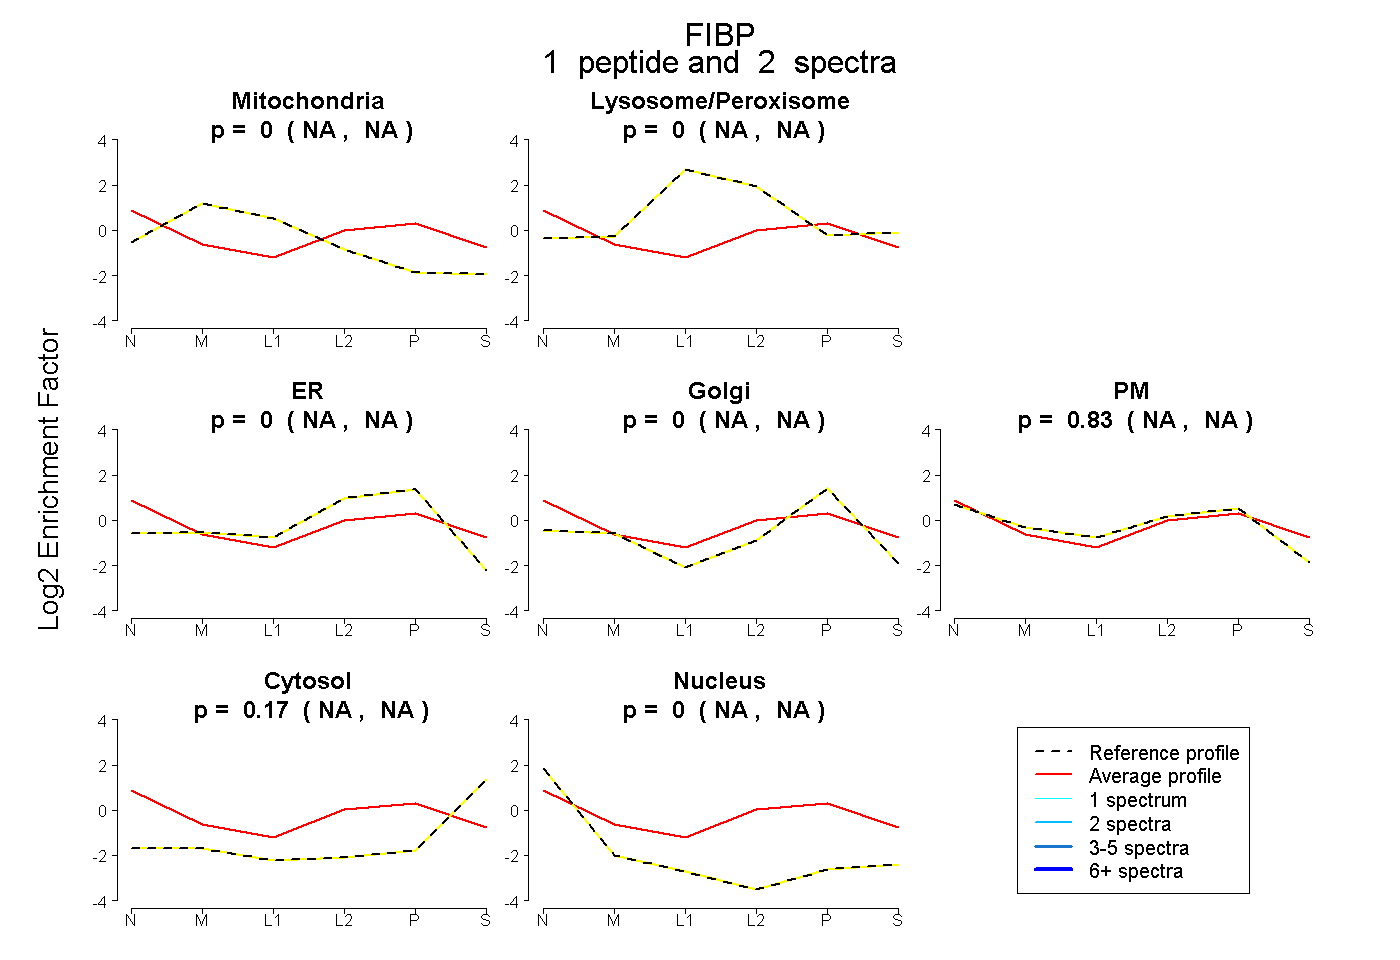
NA | NA
NA | NA
NA | NA
NA | NA
NA | NA
NA | NA
NA | NA
4peptides
spectra
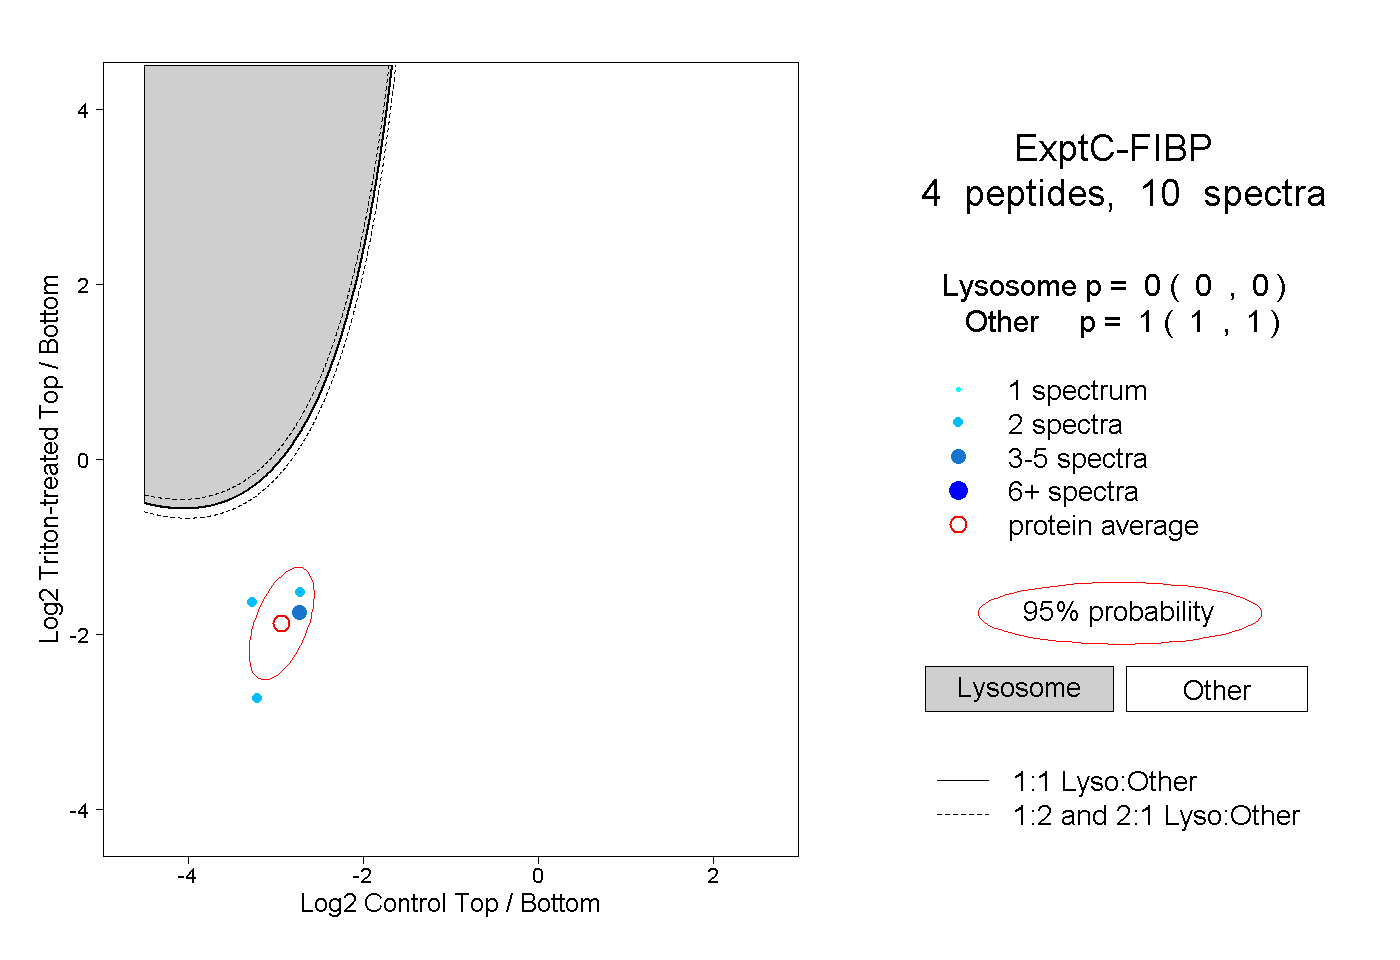
0.000 | 0.000
1.000 | 1.000