 2
2peptides
spectra
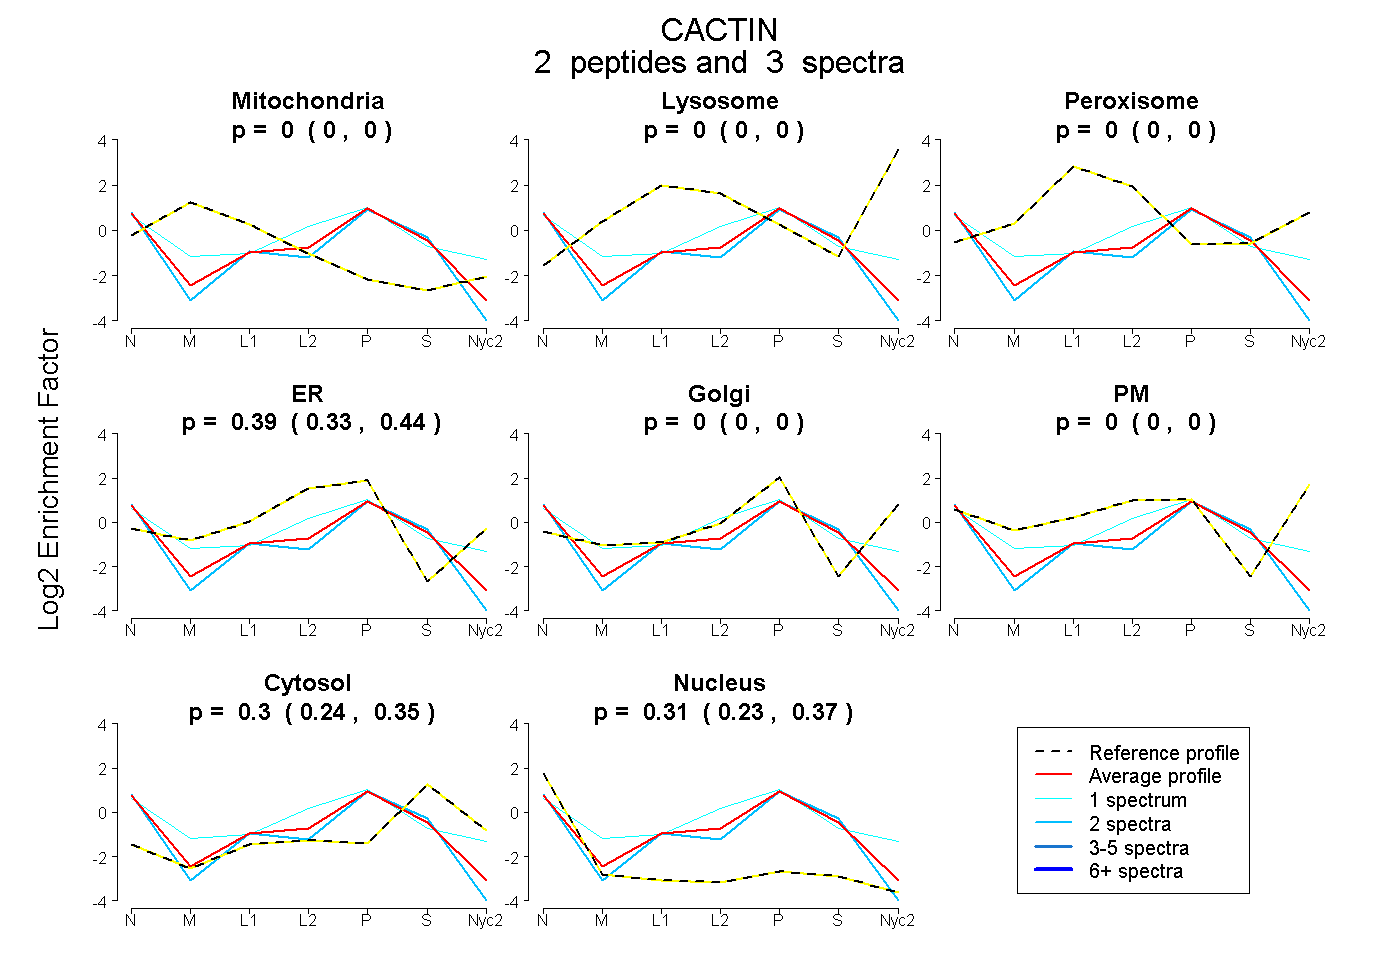
0.000 | 0.000
0.000 | 0.000
0.000 | 0.000
0.328 | 0.441
0.000 | 0.000
0.000 | 0.000
0.241 | 0.349
0.230 | 0.371
| Plot | Mito | Lyso | Perox | ER | Golgi | PM | Cytosol | Nucleus | |||||
| Expt A |
2 peptides |
3 spectra |
|
0.000 0.000 | 0.000 |
0.000 0.000 | 0.000 |
0.000 0.000 | 0.000 |
0.393 0.328 | 0.441 |
0.000 0.000 | 0.000 |
0.000 0.000 | 0.000 |
0.301 0.241 | 0.349 |
0.306 0.230 | 0.371 |
| 1 spectrum, SLRPPR | 0.000 | 0.000 | 0.000 | 0.587 | 0.000 | 0.000 | 0.279 | 0.134 | ||
| 2 spectra, EQELELLQR | 0.000 | 0.000 | 0.000 | 0.296 | 0.000 | 0.000 | 0.311 | 0.393 |