 1
1peptide
spectra
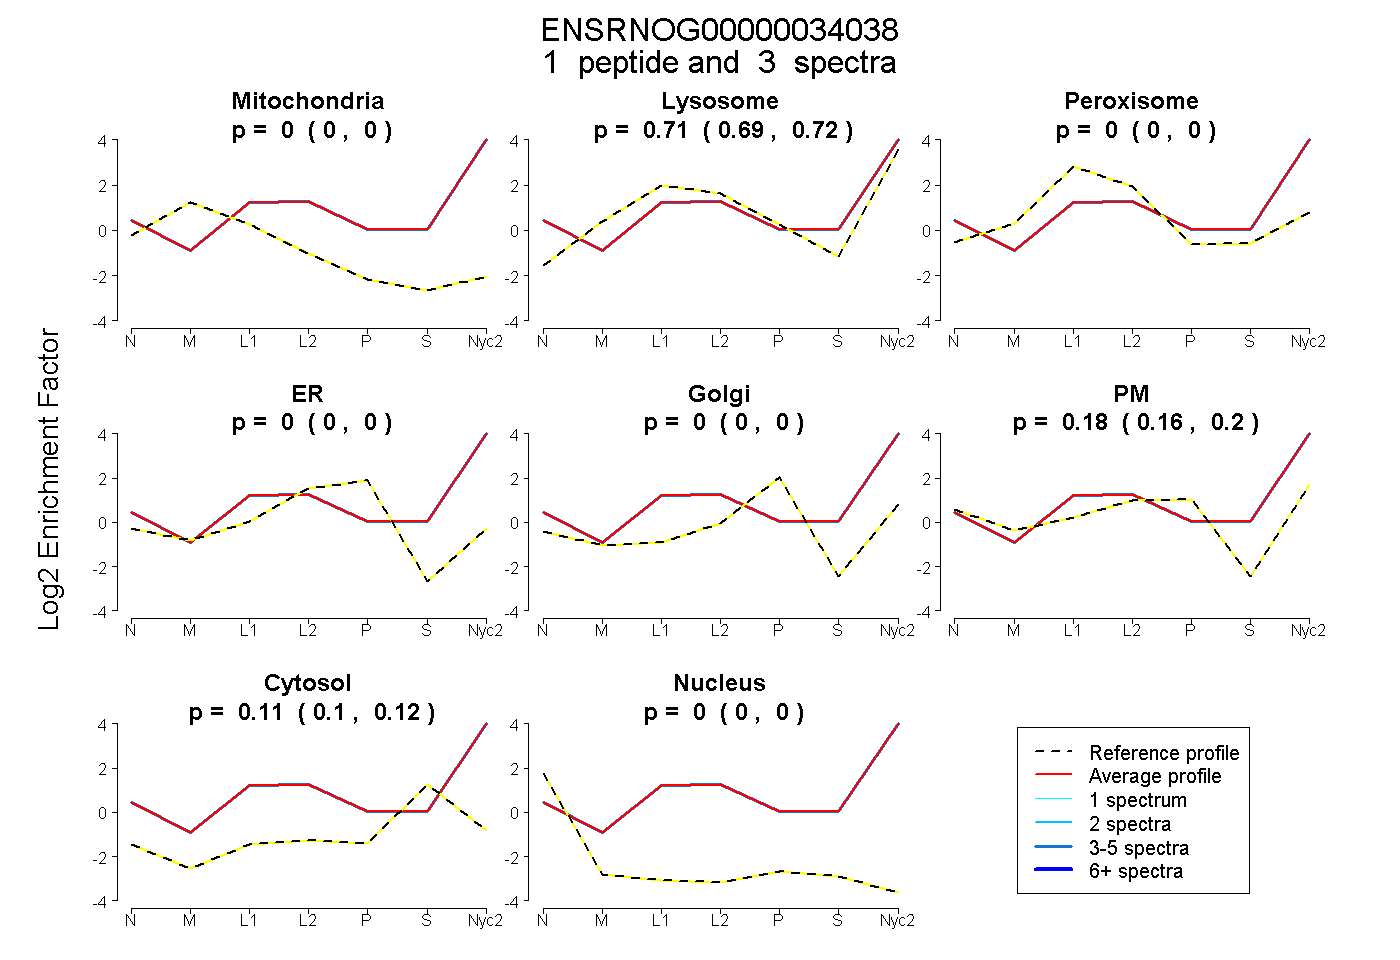
0.000 | 0.000
0.691 | 0.718
0.000 | 0.000
0.000 | 0.000
0.000 | 0.000
0.162 | 0.197
0.103 | 0.122
0.000 | 0.000
2peptides
spectra
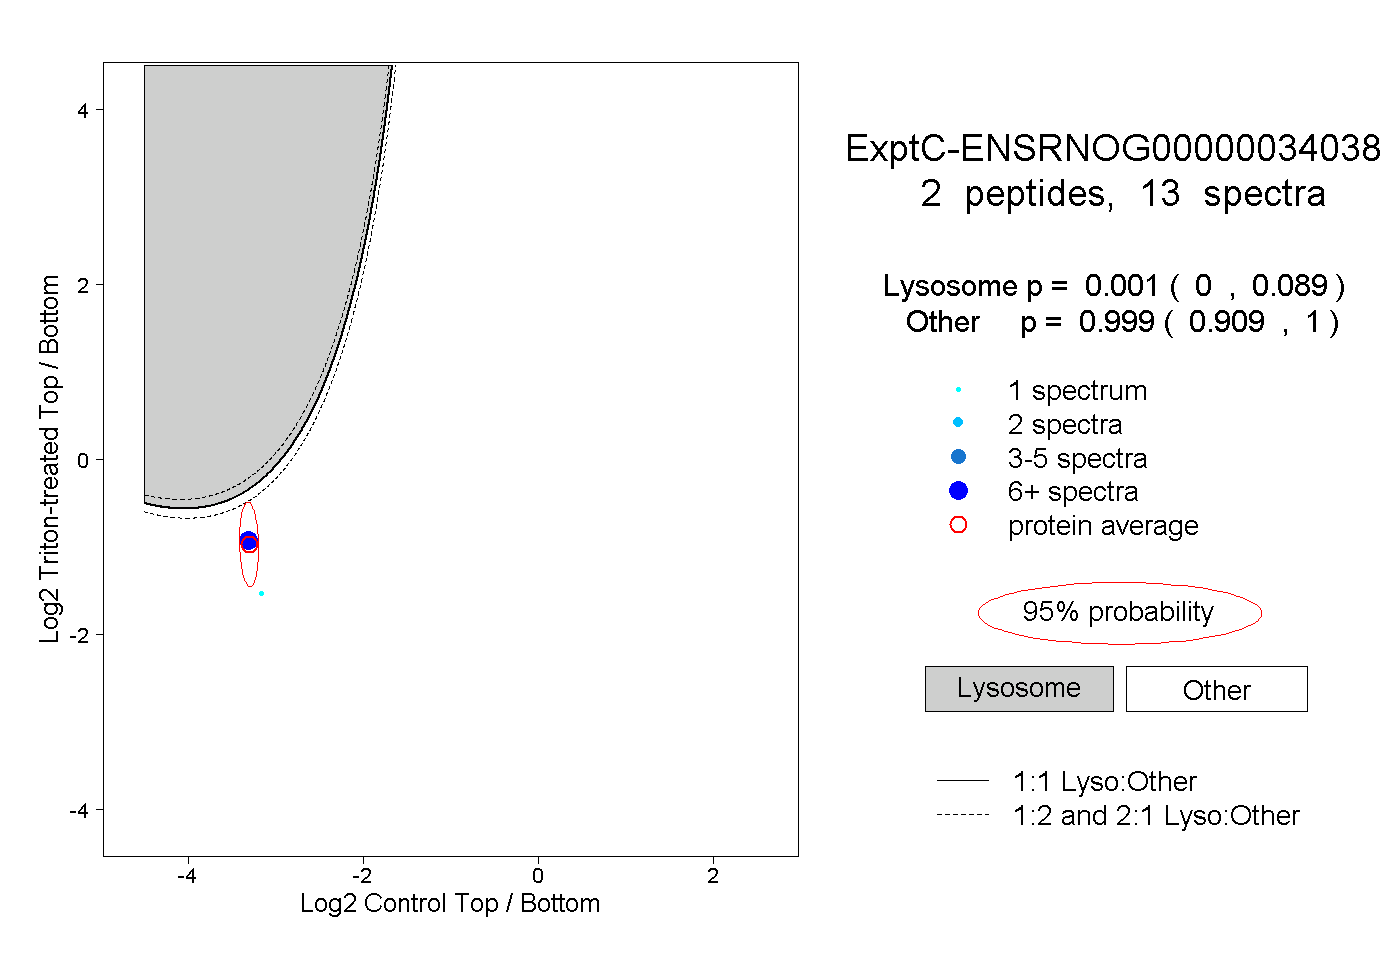
0.000 | 0.089
0.909 | 1.000
| Plot | Mito | Lyso | Perox | ER | Golgi | PM | Cytosol | Nucleus | |||||
| Expt A |
1 peptide |
3 spectra |
|
0.000 0.000 | 0.000 |
0.706 0.691 | 0.718 |
0.000 0.000 | 0.000 |
0.000 0.000 | 0.000 |
0.000 0.000 | 0.000 |
0.181 0.162 | 0.197 |
0.113 0.103 | 0.122 |
0.000 0.000 | 0.000 |
||
| Plot | Lyso | Other | |||||||||||
| Expt C |
2 peptides |
13 spectra |
|
0.001 0.000 | 0.089 |
0.999 0.909 | 1.000 |