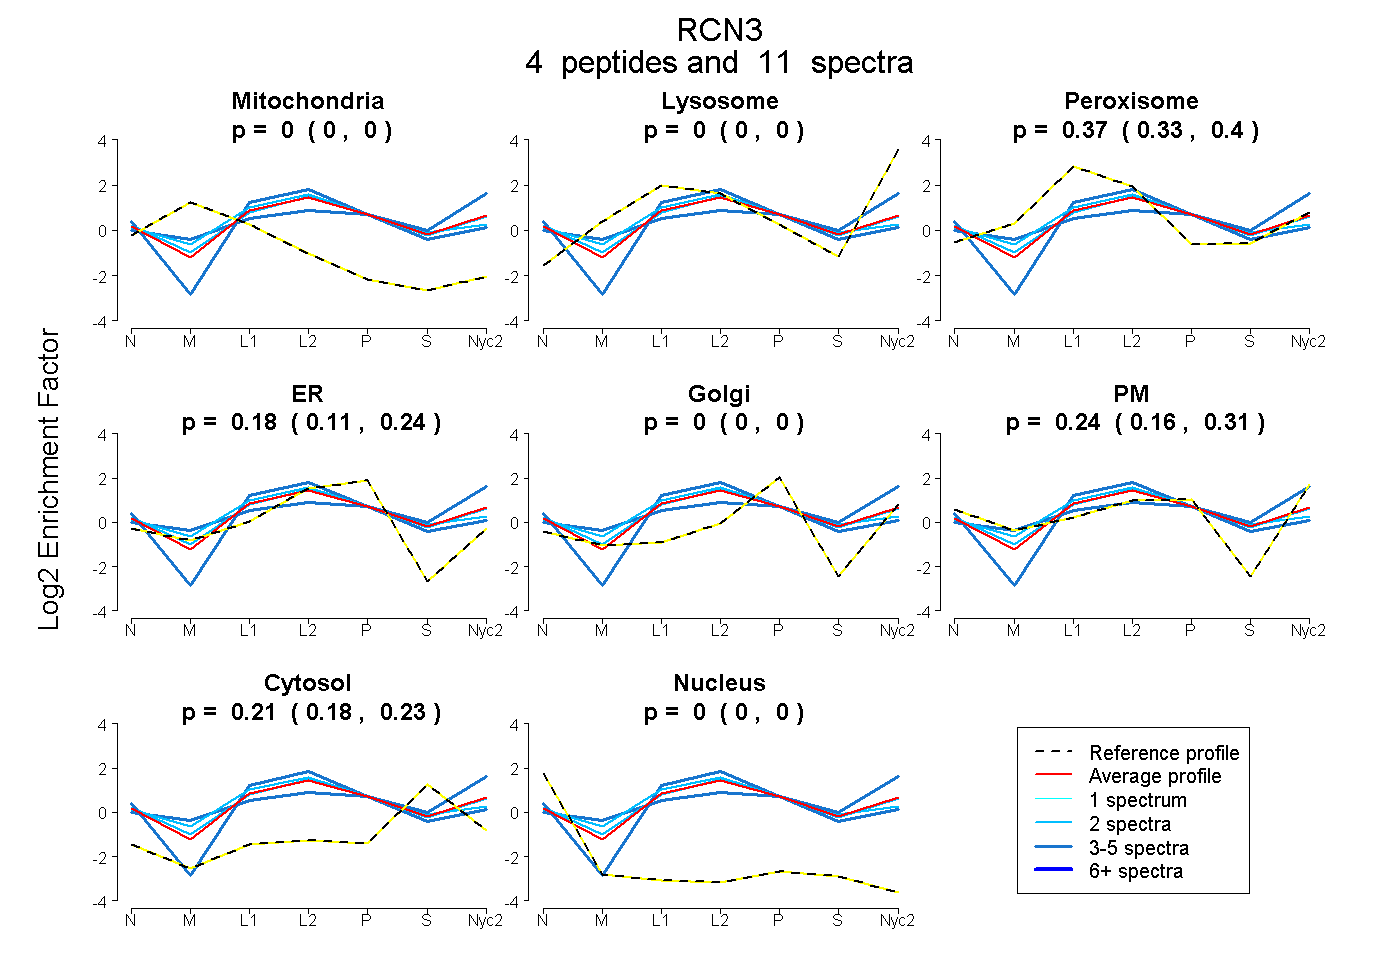
 4
4peptides
spectra
0.000 | 0.000
0.000 | 0.000
0.333 | 0.398
0.107 | 0.241
0.000 | 0.000
0.163 | 0.310
0.183 | 0.230
0.000 | 0.000
| Plot | Mito | Lyso | Perox | ER | Golgi | PM | Cytosol | Nucleus | |||||
| Expt A |
4 peptides |
11 spectra |
|
0.000 0.000 | 0.000 |
0.000 0.000 | 0.000 |
0.369 0.333 | 0.398 |
0.182 0.107 | 0.241 |
0.000 0.000 | 0.000 |
0.241 0.163 | 0.310 |
0.209 0.183 | 0.230 |
0.000 0.000 | 0.000 |
| 3 spectra, EELTAFLHPEEFPHMR | 0.000 | 0.103 | 0.264 | 0.022 | 0.000 | 0.373 | 0.238 | 0.000 | ||
| 2 spectra, VGWEELR | 0.000 | 0.000 | 0.450 | 0.192 | 0.000 | 0.207 | 0.150 | 0.000 | ||
| 4 spectra, AWIAHTQQR | 0.000 | 0.000 | 0.334 | 0.268 | 0.046 | 0.129 | 0.222 | 0.000 | ||
| 2 spectra, DIVVAETLEDLDK | 0.000 | 0.000 | 0.393 | 0.286 | 0.000 | 0.109 | 0.212 | 0.000 |
| Plot | Lyso | Other | |||||||||||
| Expt C |
3 peptides |
12 spectra |
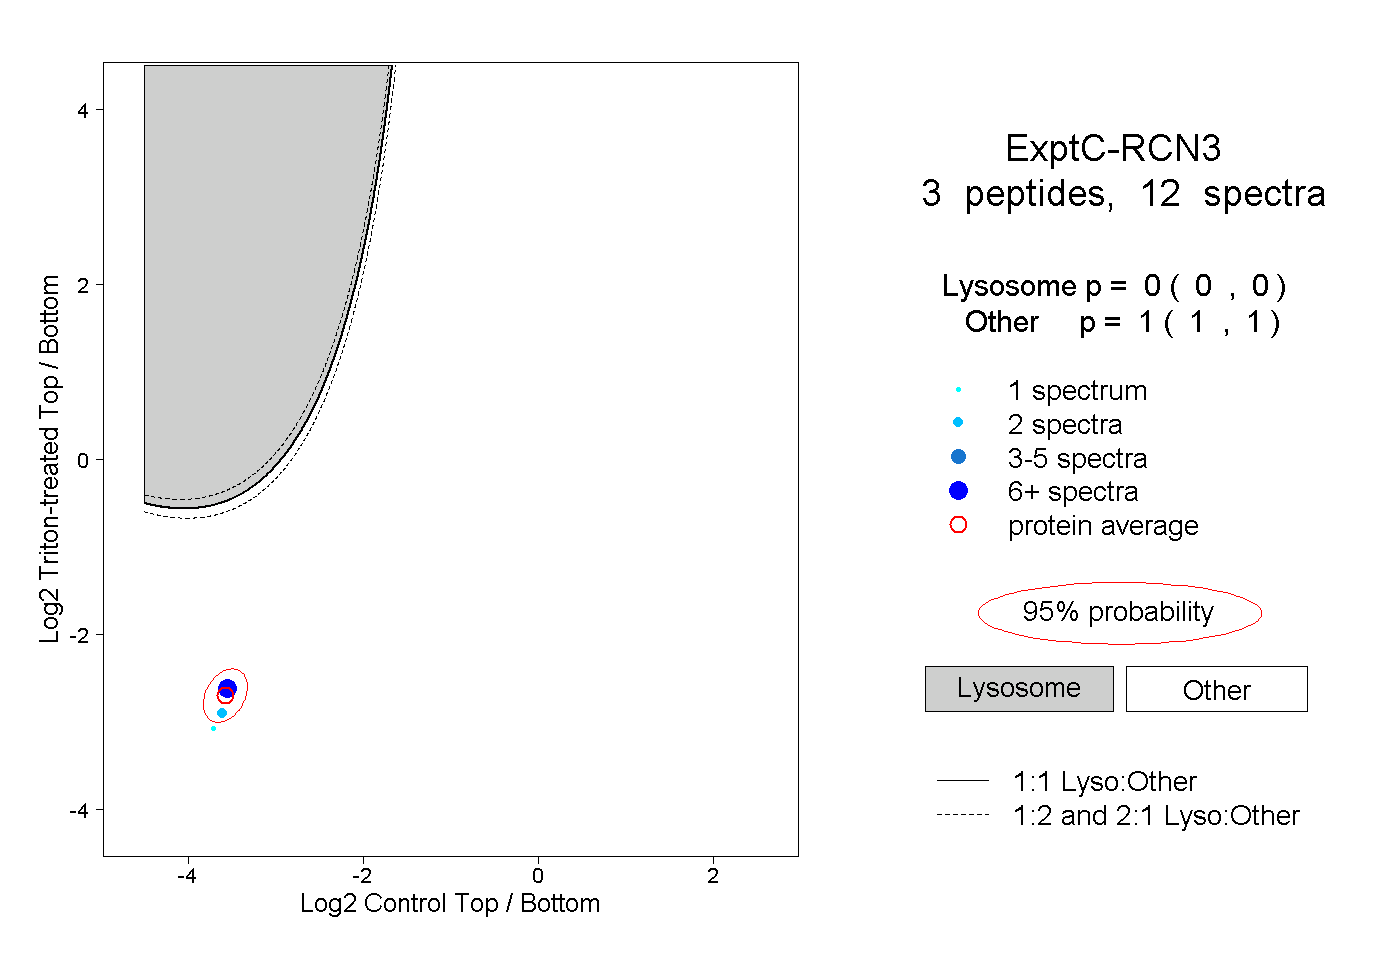 |
0.000 0.000 | 0.000 |
1.000 1.000 | 1.000 |
||||||||
| Plot | Lyso | Other | |||||||||||
| Expt D |
1 peptide |
2 spectra |
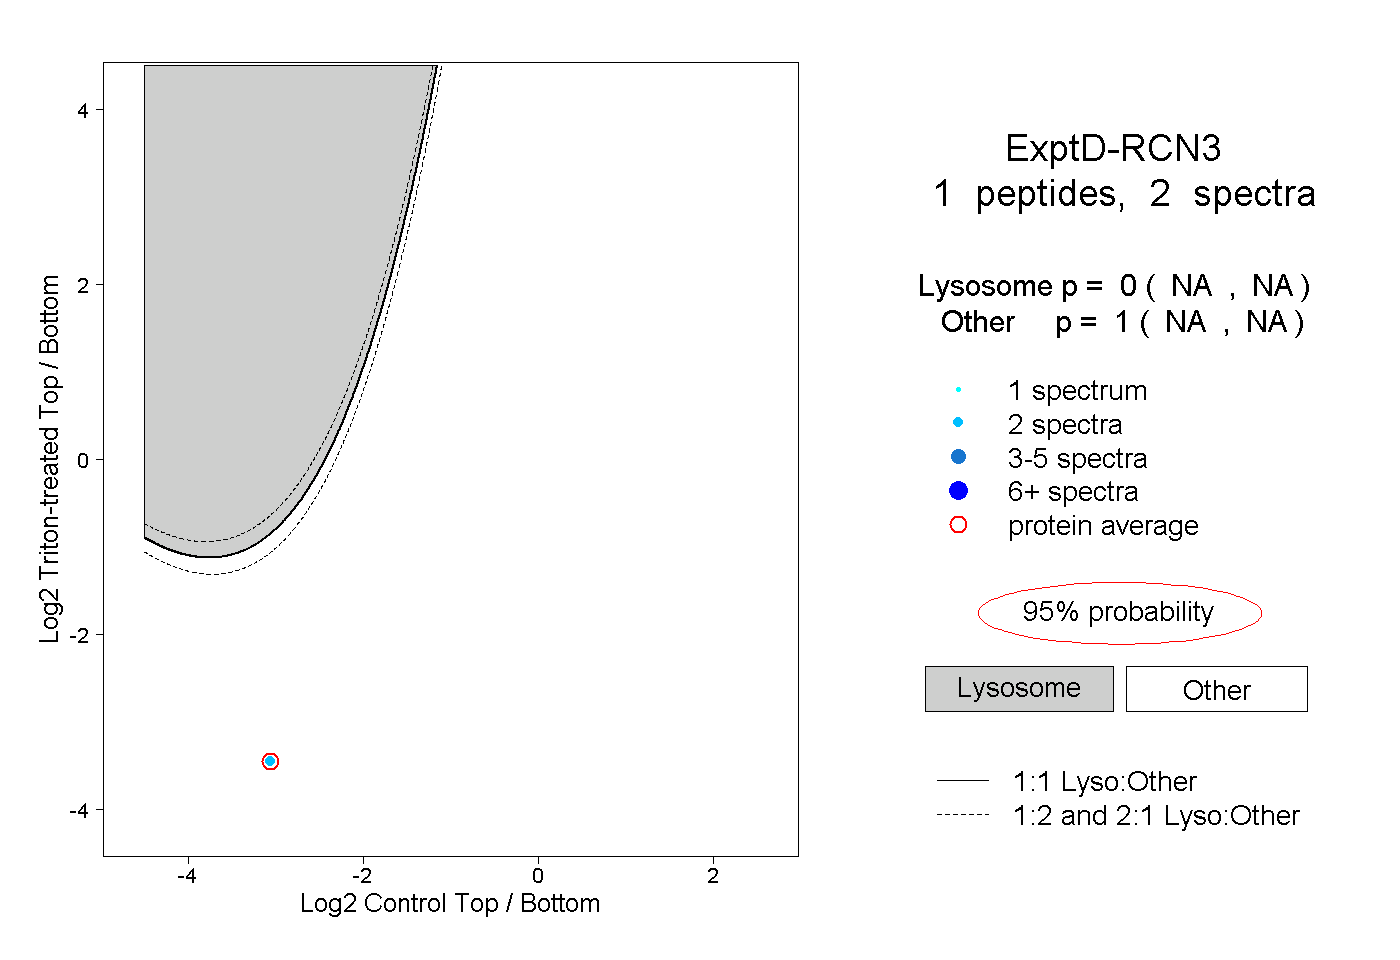 |
0.000 NA | NA |
1.000 NA | NA |