 3
3peptides
spectra
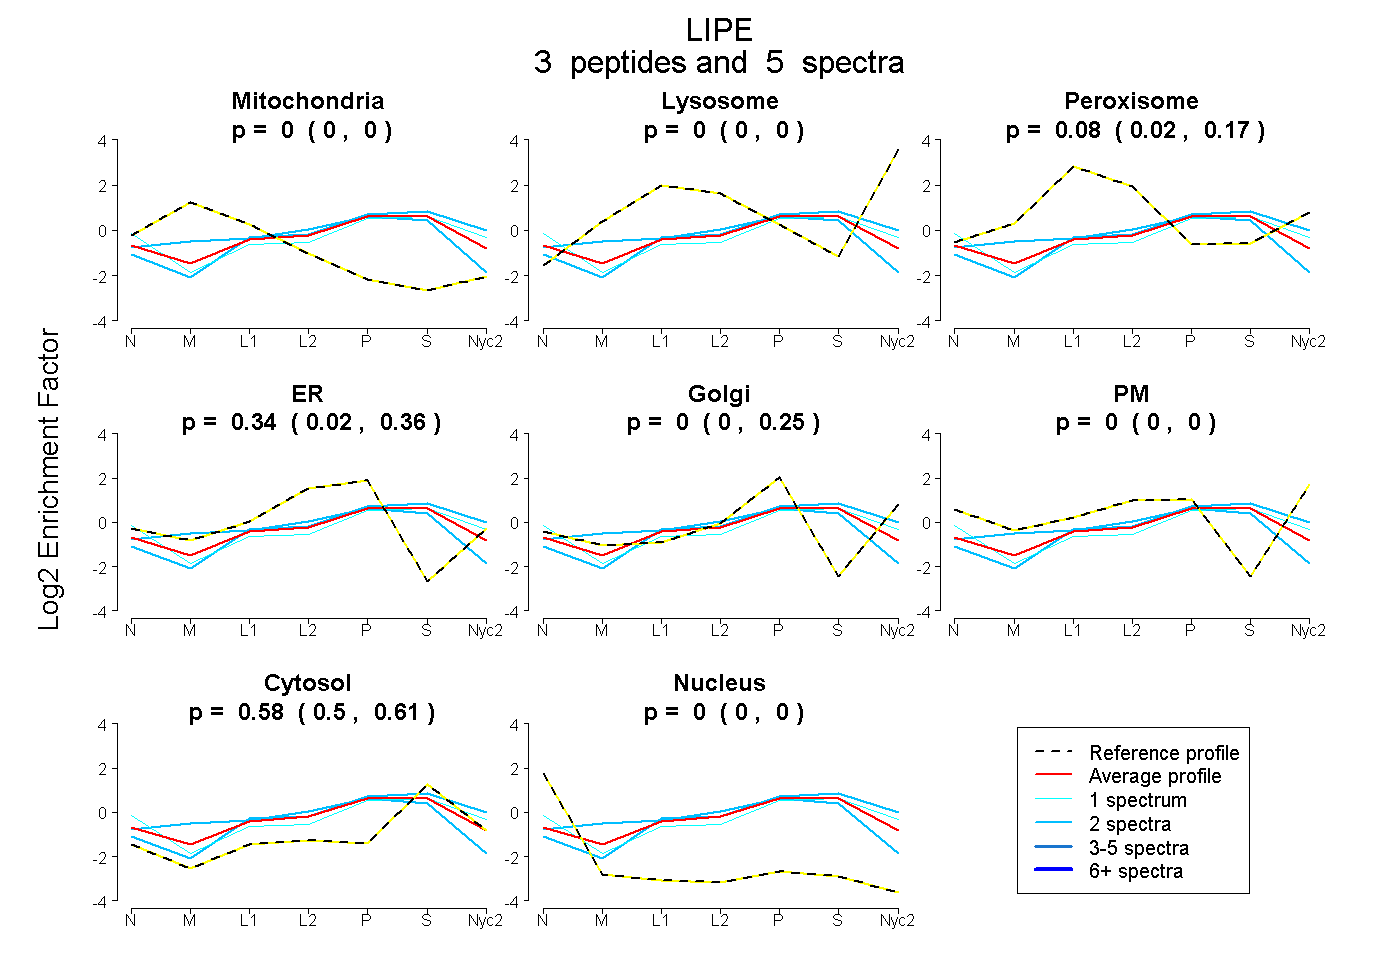
0.000 | 0.000
0.000 | 0.000
0.018 | 0.169
0.019 | 0.364
0.000 | 0.248
0.000 | 0.000
0.500 | 0.612
0.000 | 0.000
| Plot | Mito | Lyso | Perox | ER | Golgi | PM | Cytosol | Nucleus | |||||
| Expt A |
3 peptides |
5 spectra |
|
0.000 0.000 | 0.000 |
0.000 0.000 | 0.000 |
0.081 0.018 | 0.169 |
0.337 0.019 | 0.364 |
0.000 0.000 | 0.248 |
0.000 0.000 | 0.000 |
0.582 0.500 | 0.612 |
0.000 0.000 | 0.000 |
| 1 spectrum, TPLPATETLRPTDSGR | 0.000 | 0.000 | 0.050 | 0.097 | 0.187 | 0.078 | 0.589 | 0.000 | ||
| 2 spectra, LELRPRPQQAPR | 0.109 | 0.000 | 0.056 | 0.357 | 0.000 | 0.000 | 0.478 | 0.000 | ||
| 2 spectra, ALGVMGLVQR | 0.000 | 0.135 | 0.000 | 0.201 | 0.056 | 0.000 | 0.609 | 0.000 |
| Plot | Lyso | Other | |||||||||||
| Expt C |
6 peptides |
10 spectra |
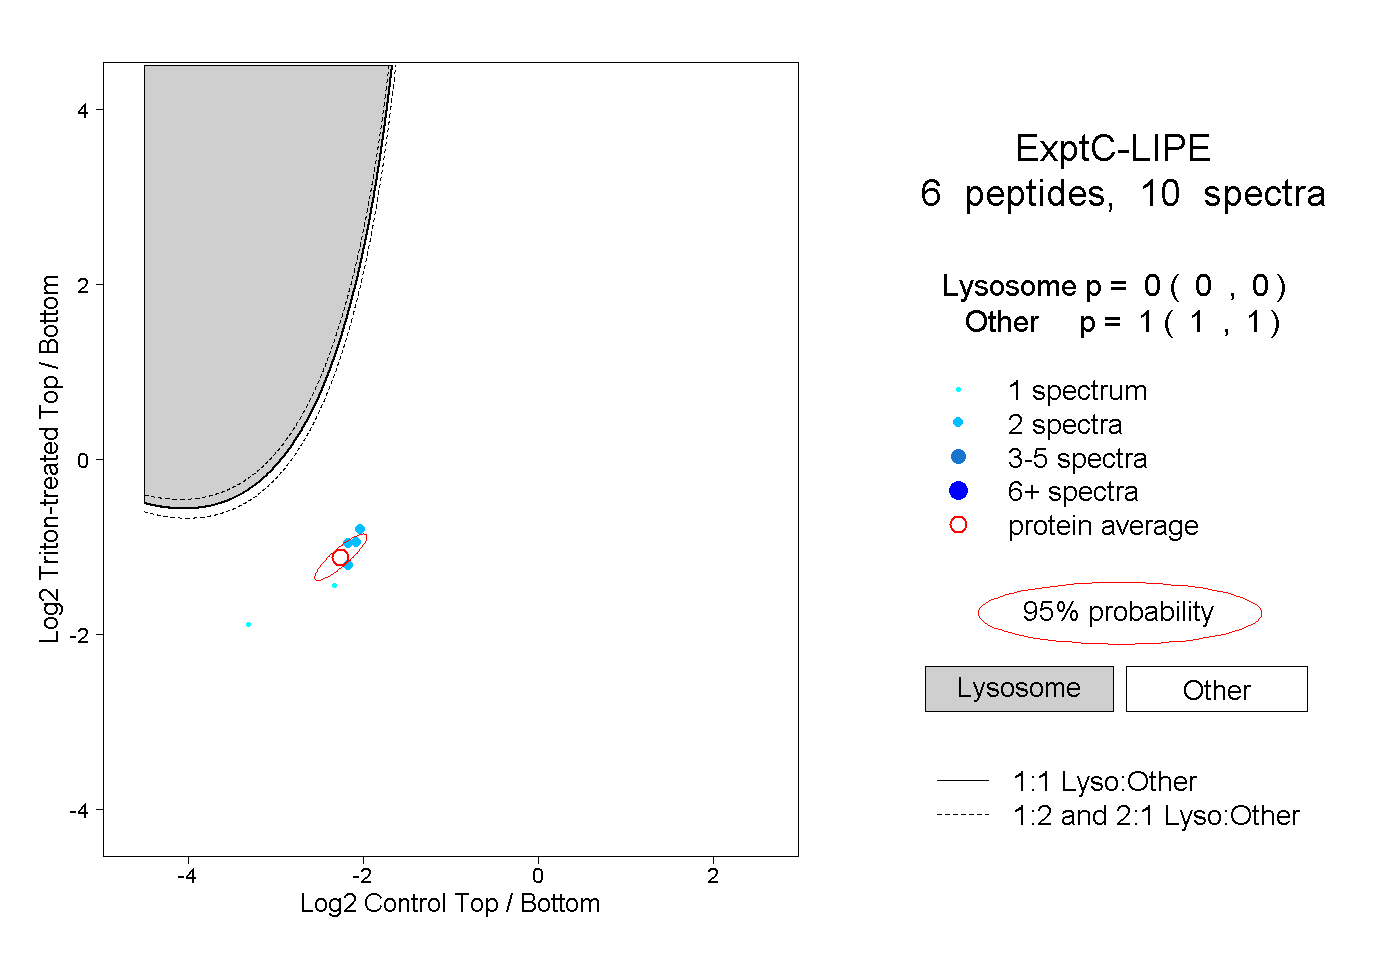 |
0.000 0.000 | 0.000 |
1.000 1.000 | 1.000 |