 2
2peptides
spectra
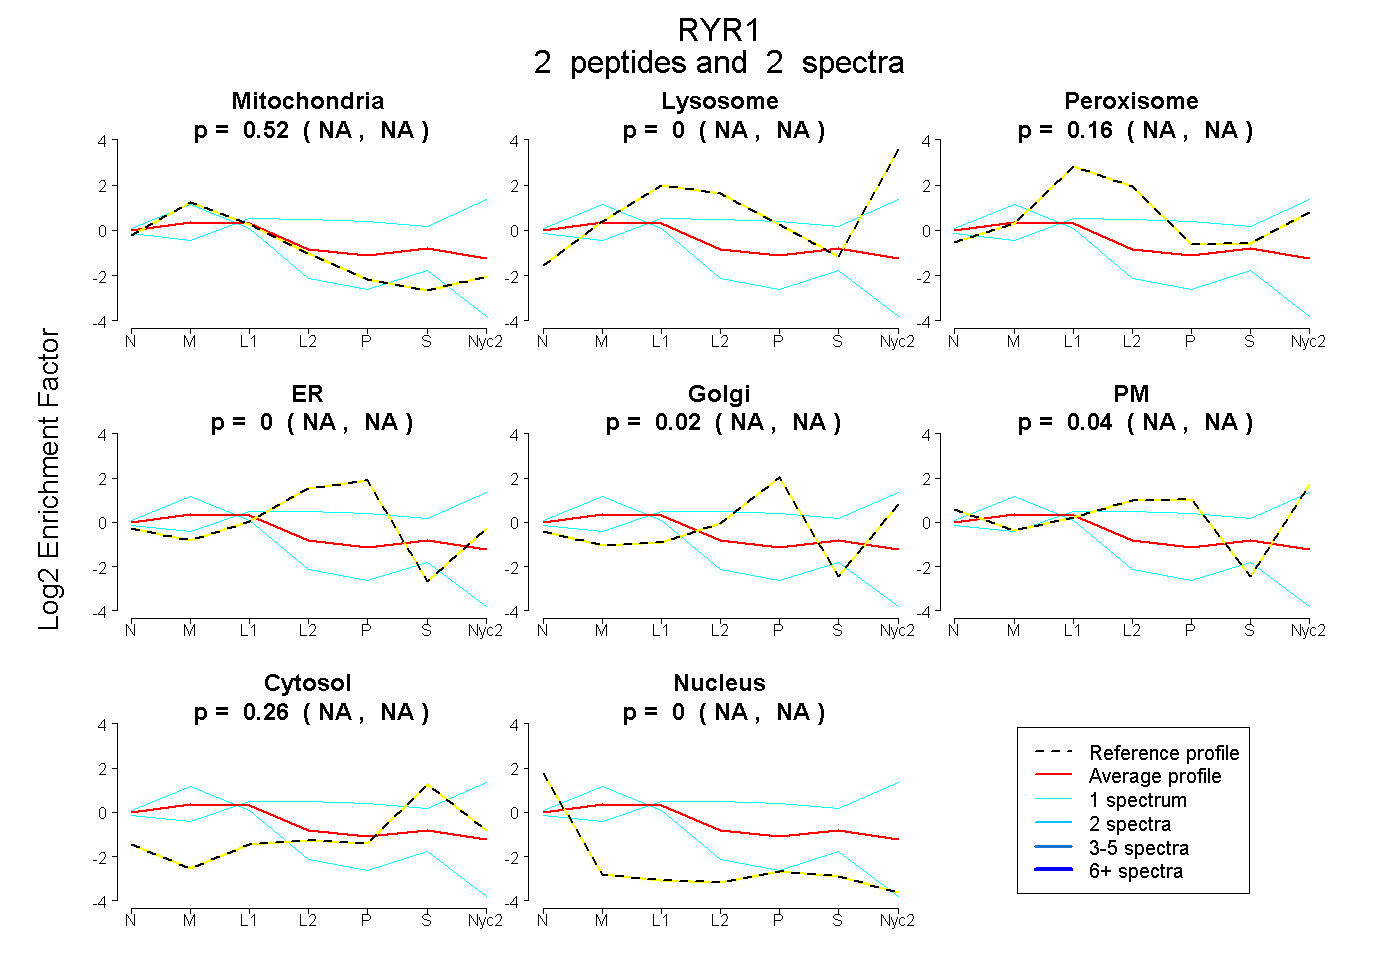
NA | NA
NA | NA
NA | NA
NA | NA
NA | NA
NA | NA
NA | NA
NA | NA
1peptide
spectra
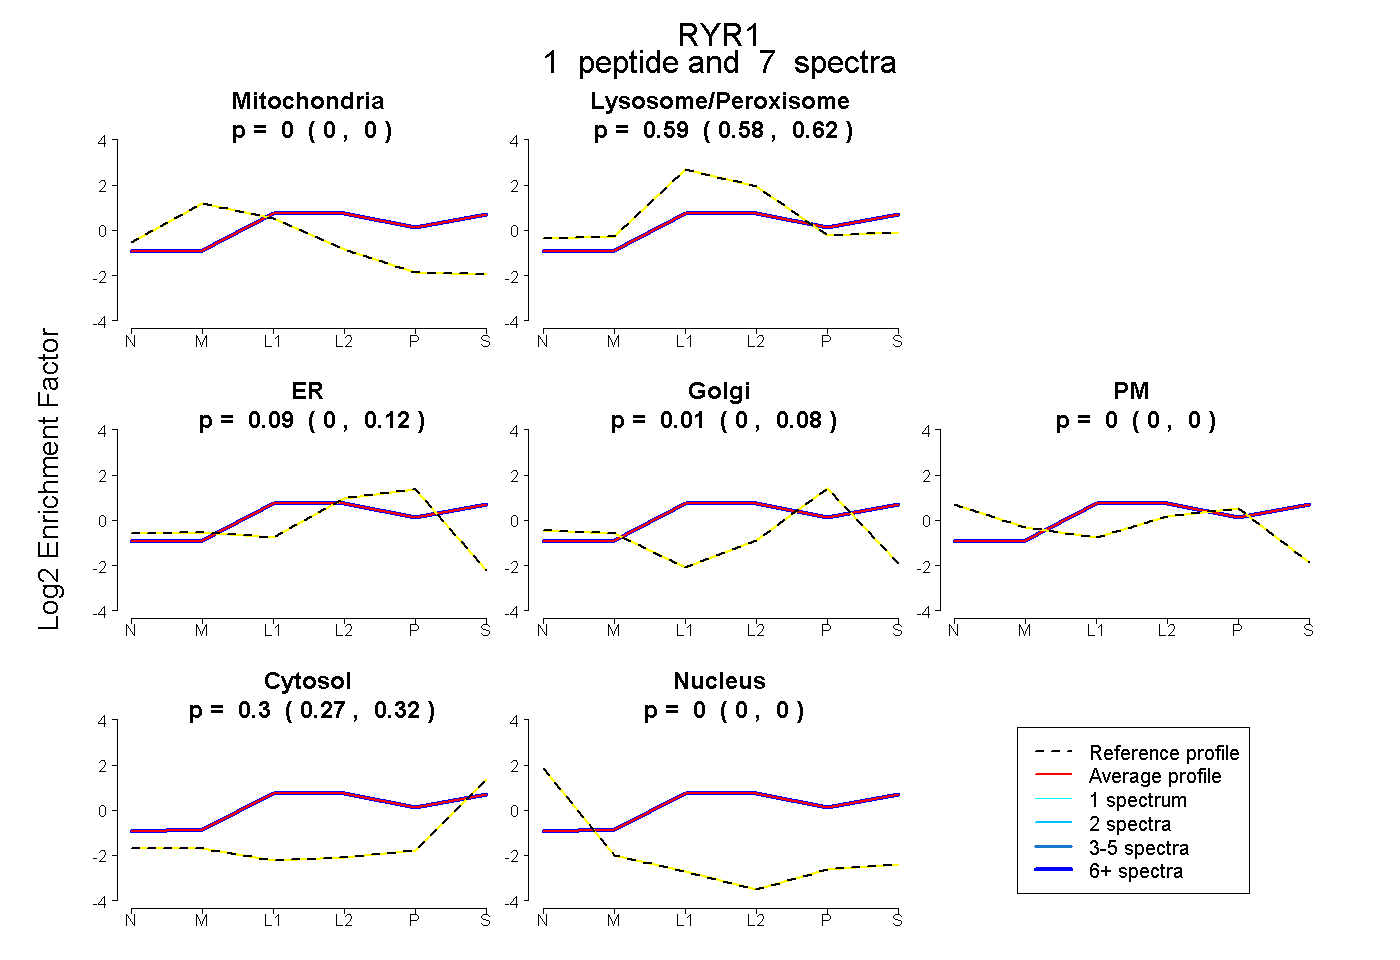
0.000 | 0.000
0.576 | 0.621
0.000 | 0.117
0.000 | 0.083
0.000 | 0.000
0.274 | 0.317
0.000 | 0.000
1peptide
spectrum
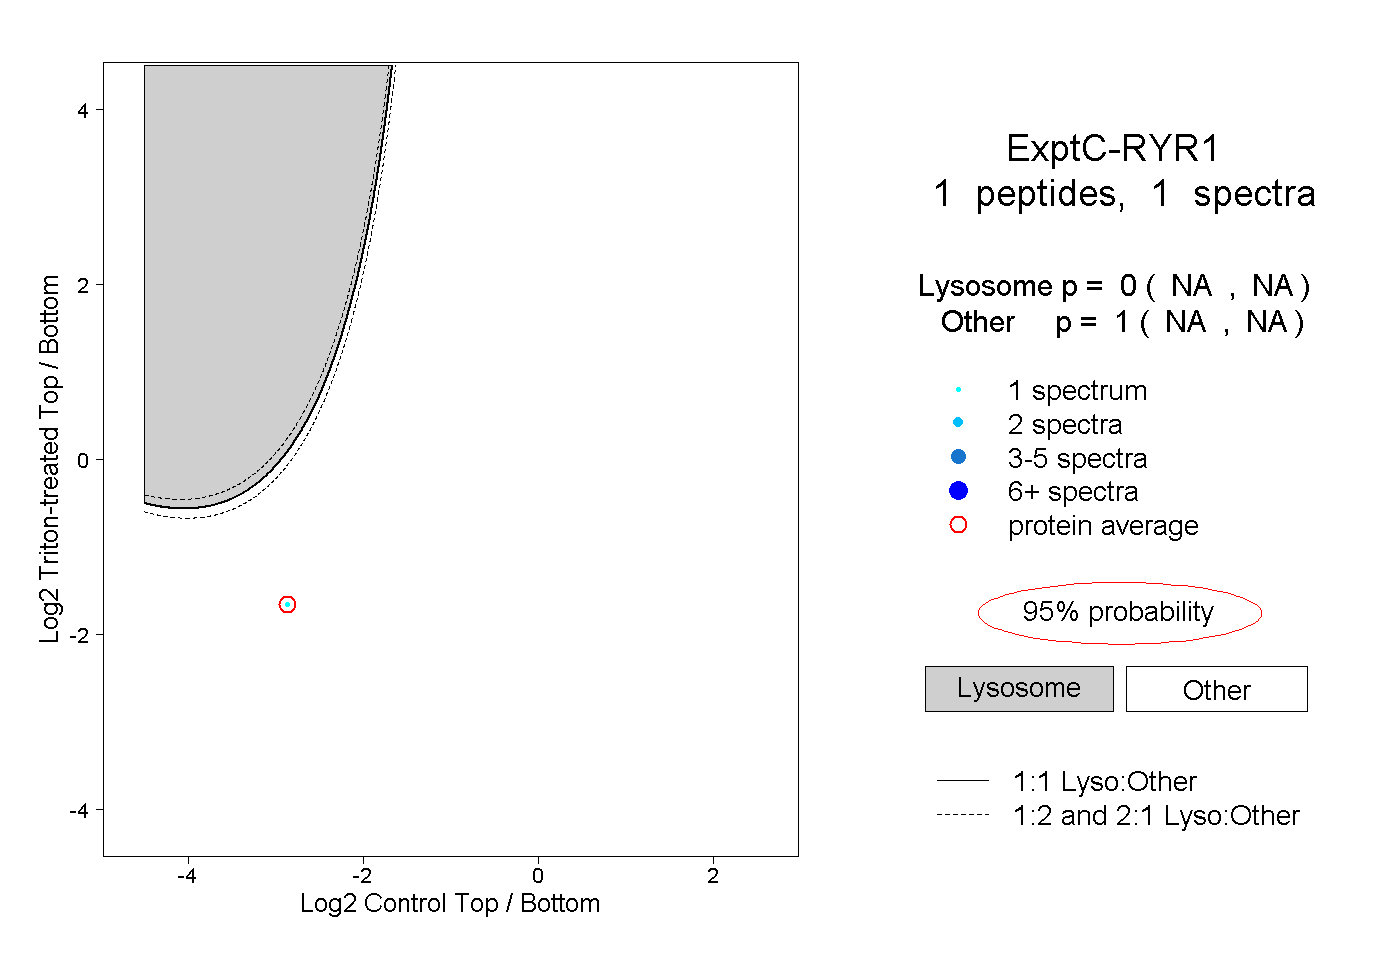
NA | NA
NA | NA
1peptide
spectra
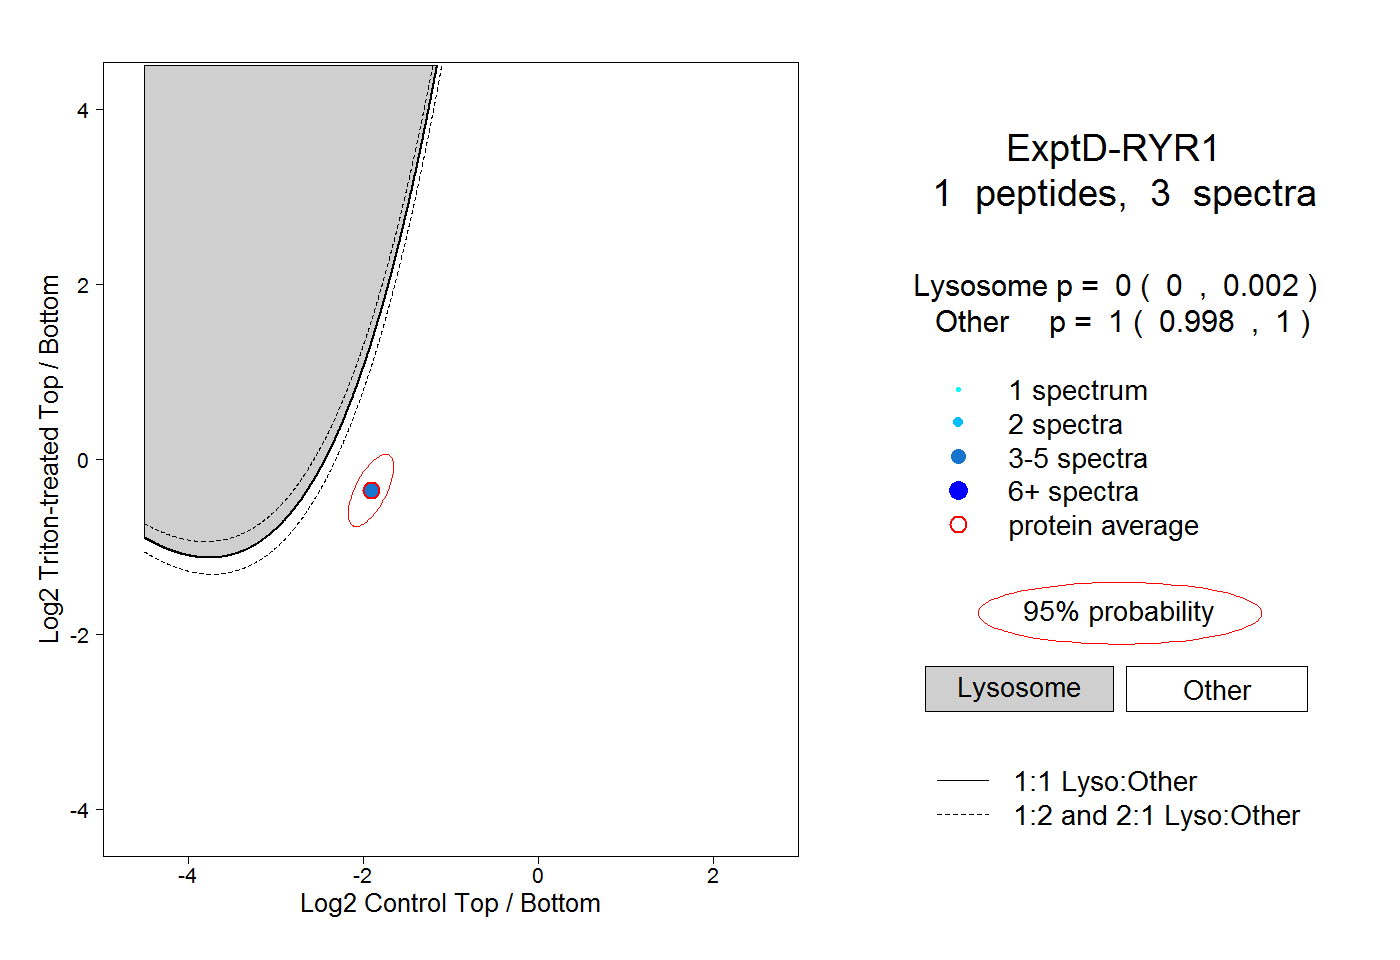
0.000 | 0.002
0.998 | 1.000