 5
5peptides
spectra
0.000 | 0.000
0.000 | 0.000
0.000 | 0.012
0.024 | 0.217
0.000 | 0.107
0.000 | 0.000
0.537 | 0.591
0.210 | 0.278
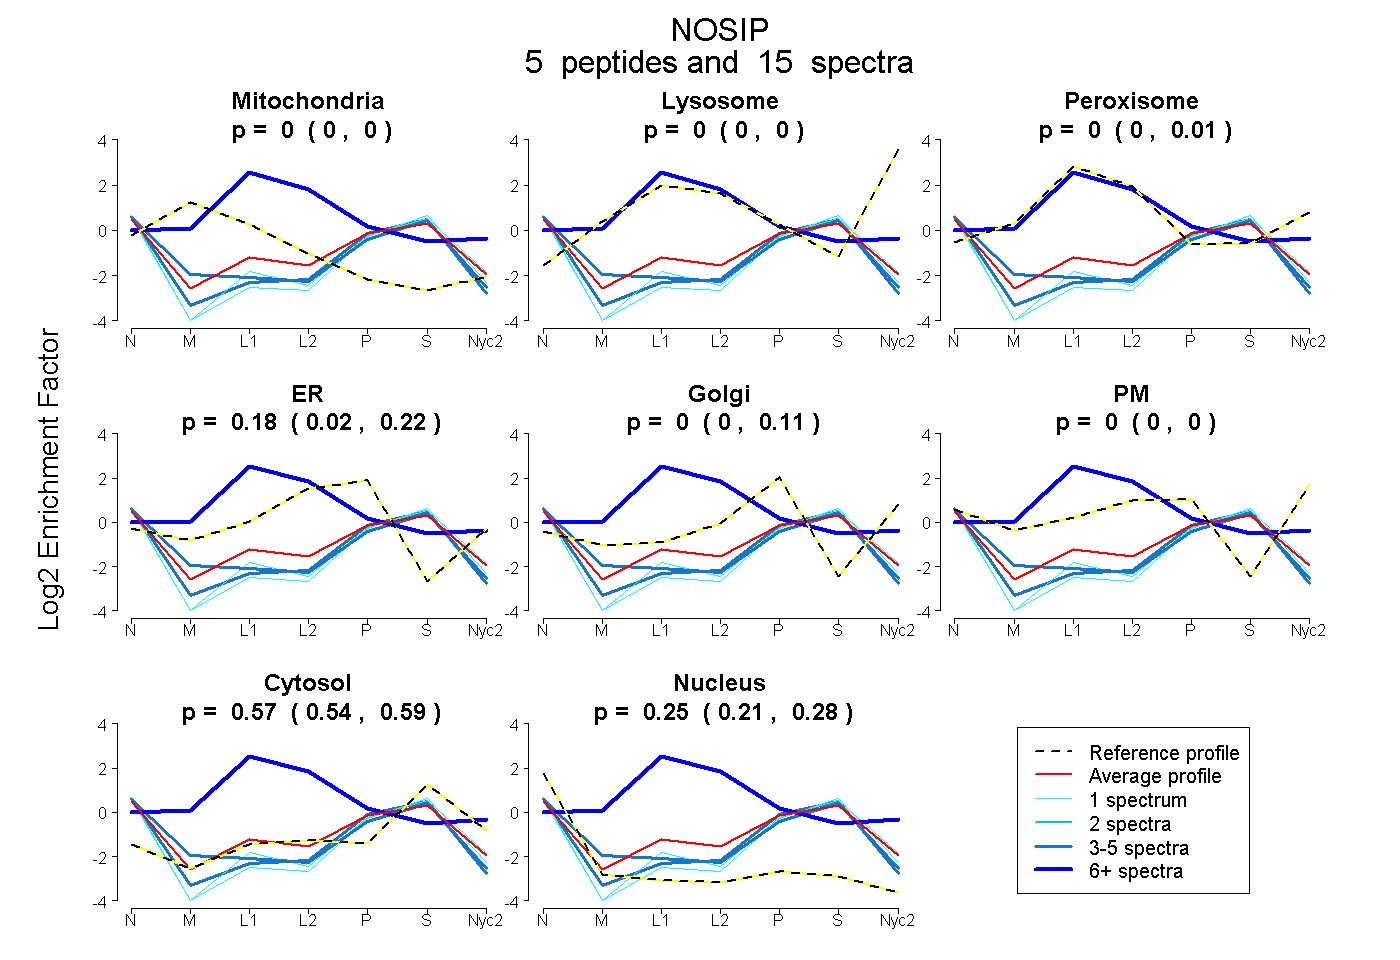
| Plot | Mito | Lyso | Perox | ER | Golgi | PM | Cytosol | Nucleus | |||||
| Expt A |
5 peptides |
15 spectra |
|
0.000 0.000 | 0.000 |
0.000 0.000 | 0.000 |
0.000 0.000 | 0.012 |
0.181 0.024 | 0.217 |
0.000 0.000 | 0.107 |
0.000 0.000 | 0.000 |
0.572 0.537 | 0.591 |
0.247 0.210 | 0.278 |
| 1 spectrum, DTAASGYGTQNIR | 0.000 | 0.000 | 0.000 | 0.000 | 0.038 | 0.000 | 0.639 | 0.324 | ||
| 3 spectra, AAAQDQVR | 0.000 | 0.000 | 0.000 | 0.000 | 0.032 | 0.000 | 0.579 | 0.390 | ||
| 6 spectra, VGLITR | 0.000 | 0.000 | 0.807 | 0.166 | 0.000 | 0.000 | 0.000 | 0.027 | ||
| 4 spectra, FTQLDDSVDR | 0.000 | 0.000 | 0.000 | 0.007 | 0.081 | 0.000 | 0.549 | 0.363 | ||
| 1 spectrum, EAILEYILHQK | 0.000 | 0.000 | 0.000 | 0.000 | 0.000 | 0.000 | 0.621 | 0.379 |