 9
9peptides
spectra
0.000 | 0.000
0.339 | 0.360
0.000 | 0.000
0.000 | 0.000
0.166 | 0.197
0.136 | 0.171
0.306 | 0.318
0.000 | 0.000
13peptides
spectra
0.000 | 0.001
0.999 | 1.000
| Plot | Mito | Lyso | Perox | ER | Golgi | PM | Cytosol | Nucleus | |||||
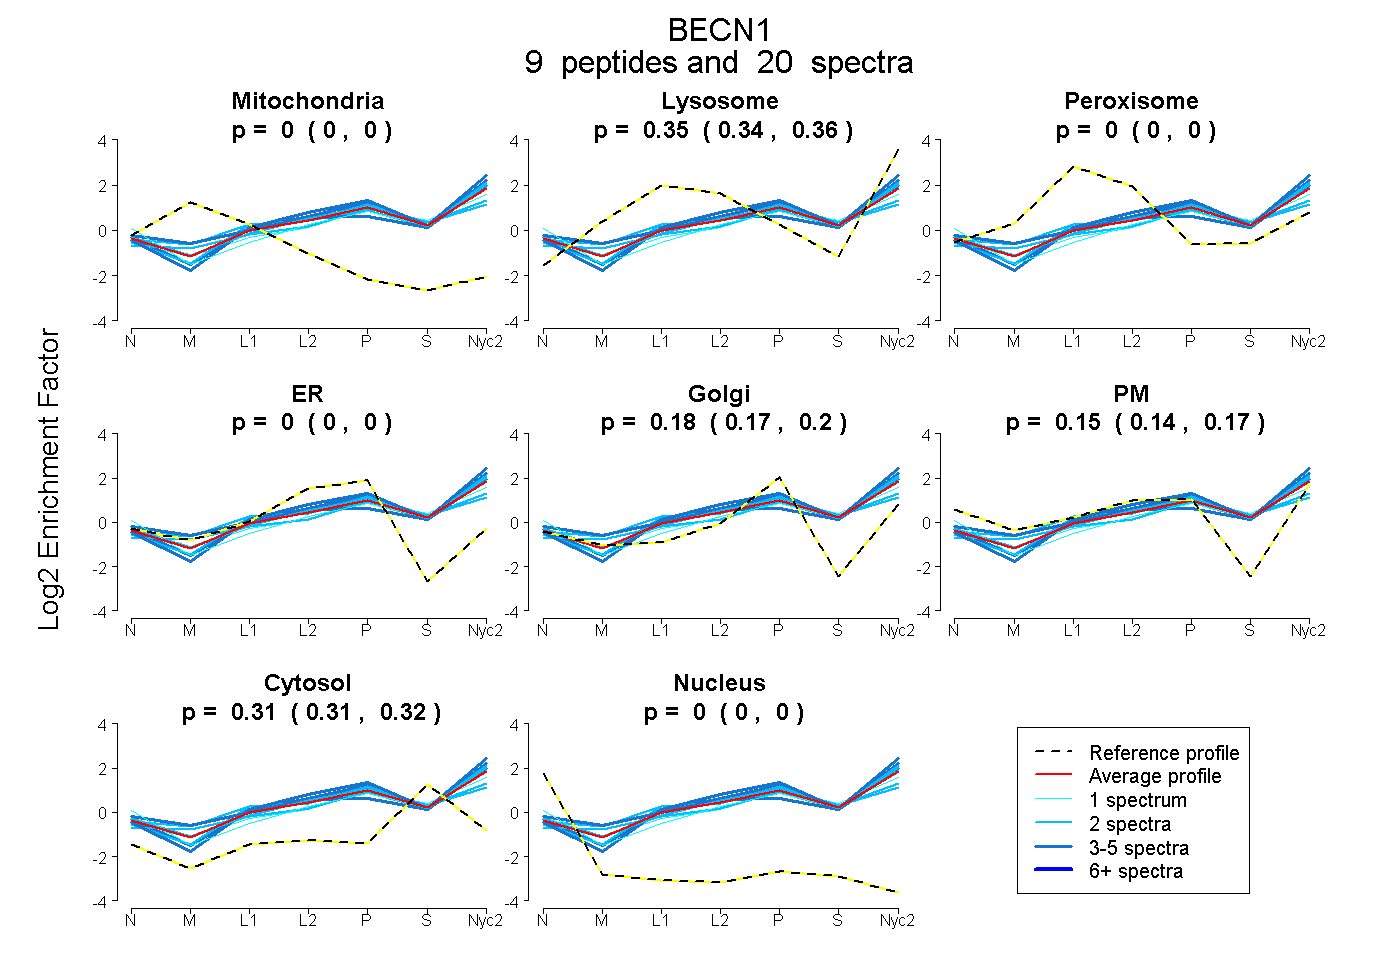
| Expt A |
9 peptides |
20 spectra |
|
0.000 0.000 | 0.000 |
0.350 0.339 | 0.360 |
0.000 0.000 | 0.000 |
0.000 0.000 | 0.000 |
0.183 0.166 | 0.197 |
0.155 0.136 | 0.171 |
0.312 0.306 | 0.318 |
0.000 0.000 | 0.000 |
||
| Plot | Lyso | Other | |||||||||||
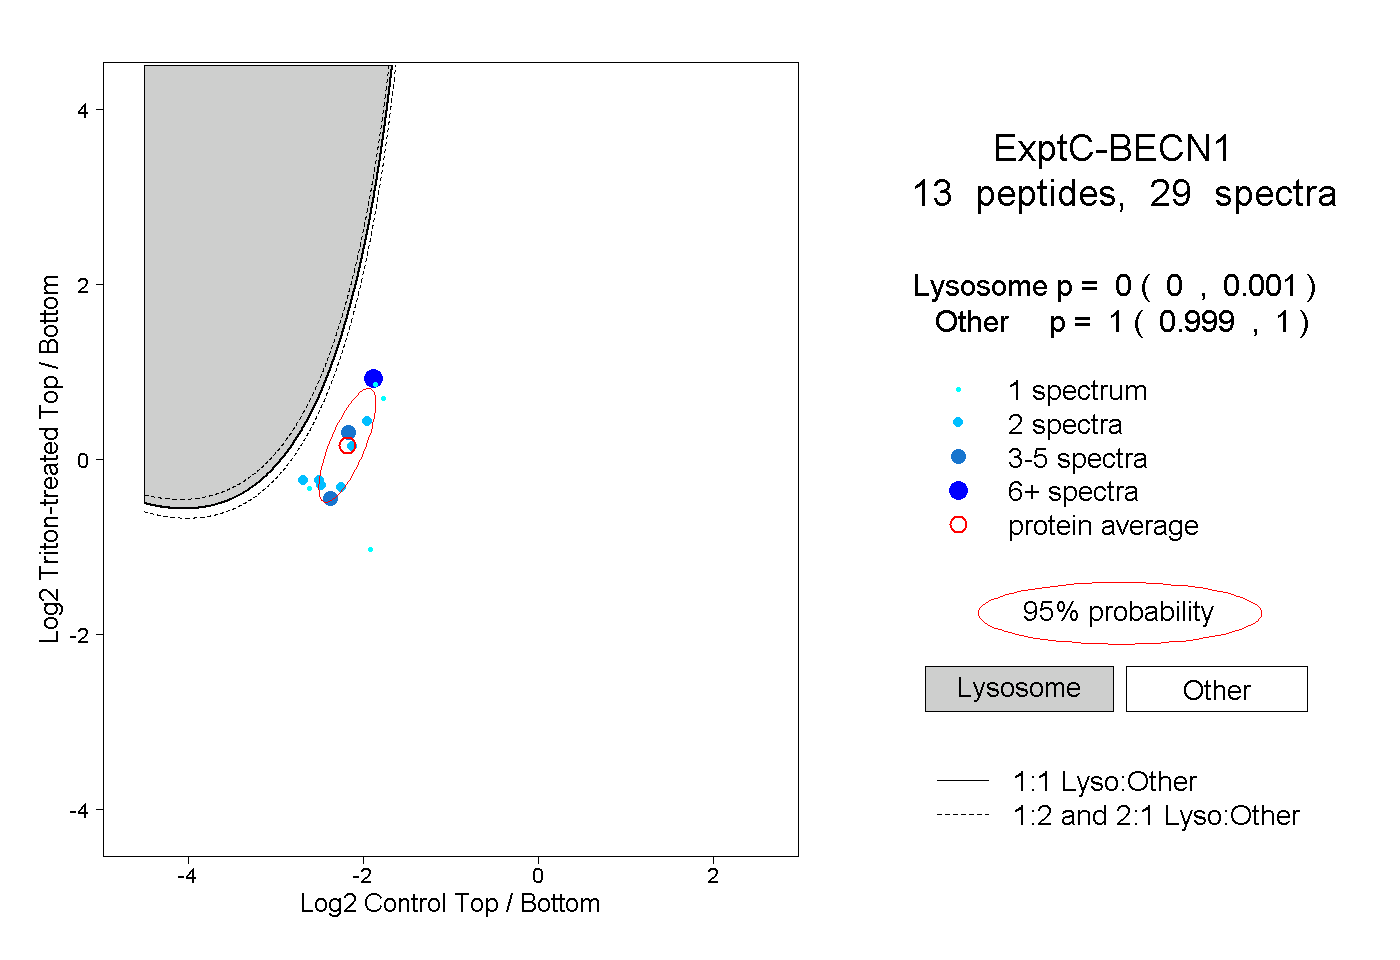
| Expt C |
13 peptides |
29 spectra |
|
0.000 0.000 | 0.001 |
1.000 0.999 | 1.000 |
| 2 spectra, VQAEAER | 0.000 | 1.000 | ||||||||
| 6 spectra, ELALEEER | 0.000 | 1.000 | ||||||||
| 4 spectra, VVAENLEK | 0.000 | 1.000 | ||||||||
| 2 spectra, SVENQMR | 0.005 | 0.995 | ||||||||
| 1 spectrum, IEDTGGSGGSYSIK | 0.000 | 1.000 | ||||||||
| 2 spectra, FCLPYR | 0.000 | 1.000 | ||||||||
| 2 spectra, ELPLYCSGGLR | 0.000 | 1.000 | ||||||||
| 2 spectra, FFWDNK | 0.000 | 1.000 | ||||||||
| 3 spectra, LVPYGNHSYLESLTDK | 0.000 | 1.000 | ||||||||
| 1 spectrum, QQLELDDELK | 0.000 | 1.000 | ||||||||
| 1 spectrum, LDQEEAQYQR | 0.001 | 0.999 | ||||||||
| 2 spectra, FMLTNLK | 0.000 | 1.000 | ||||||||
| 1 spectrum, LIQELEDVEK | 0.000 | 1.000 |
| Plot | Lyso | Other | |||||||||||
| Expt D |
3 peptides |
4 spectra |
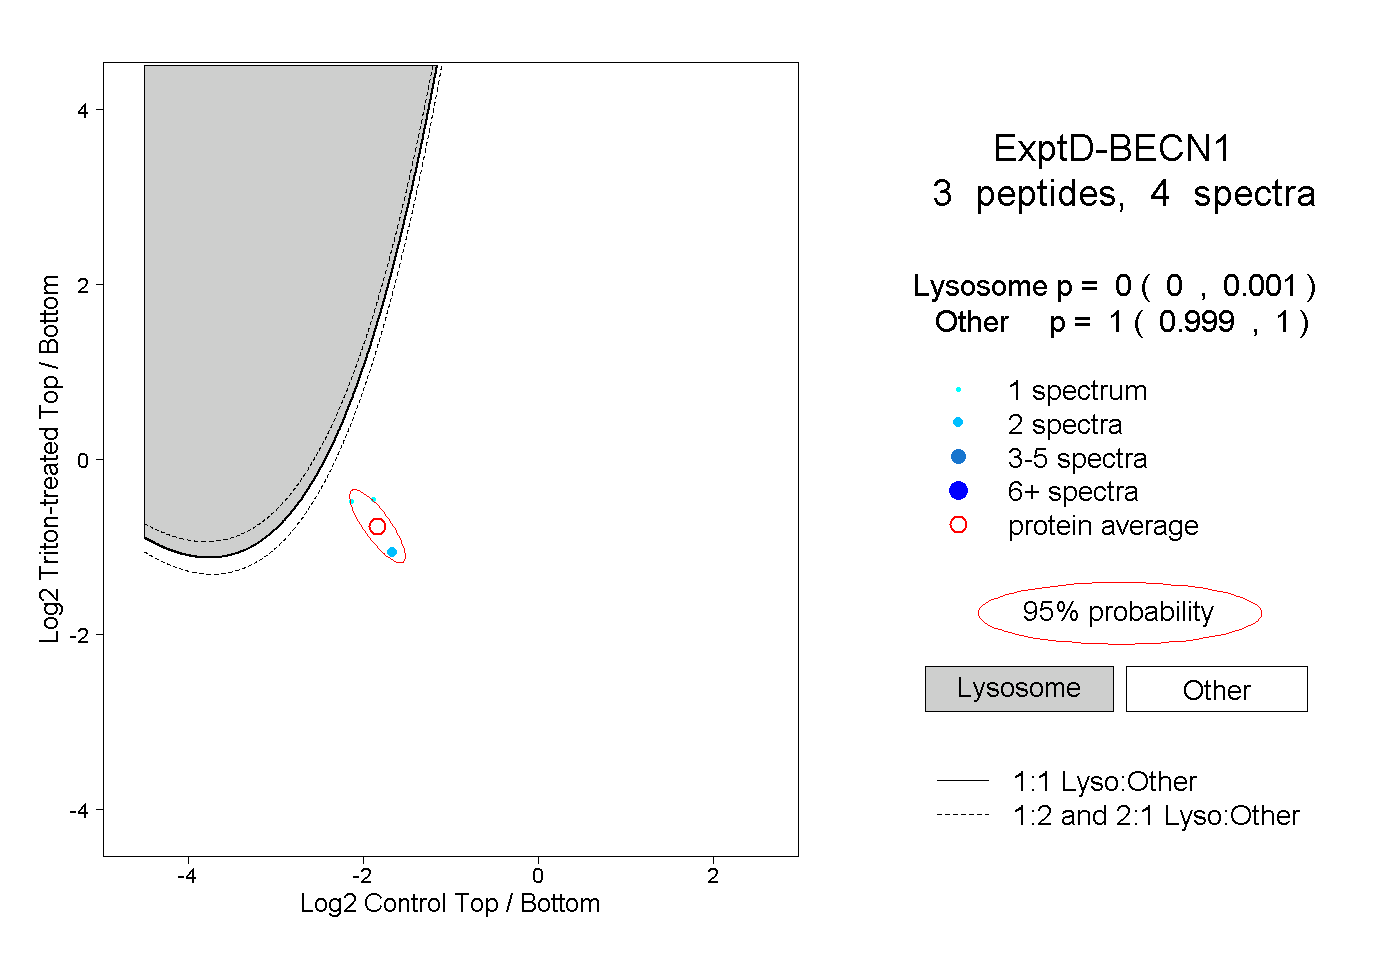 |
0.000 0.000 | 0.001 |
1.000 0.999 | 1.000 |