 9
9peptides
spectra
0.000 | 0.000
0.339 | 0.360
0.000 | 0.000
0.000 | 0.000
0.166 | 0.197
0.136 | 0.171
0.306 | 0.318
0.000 | 0.000
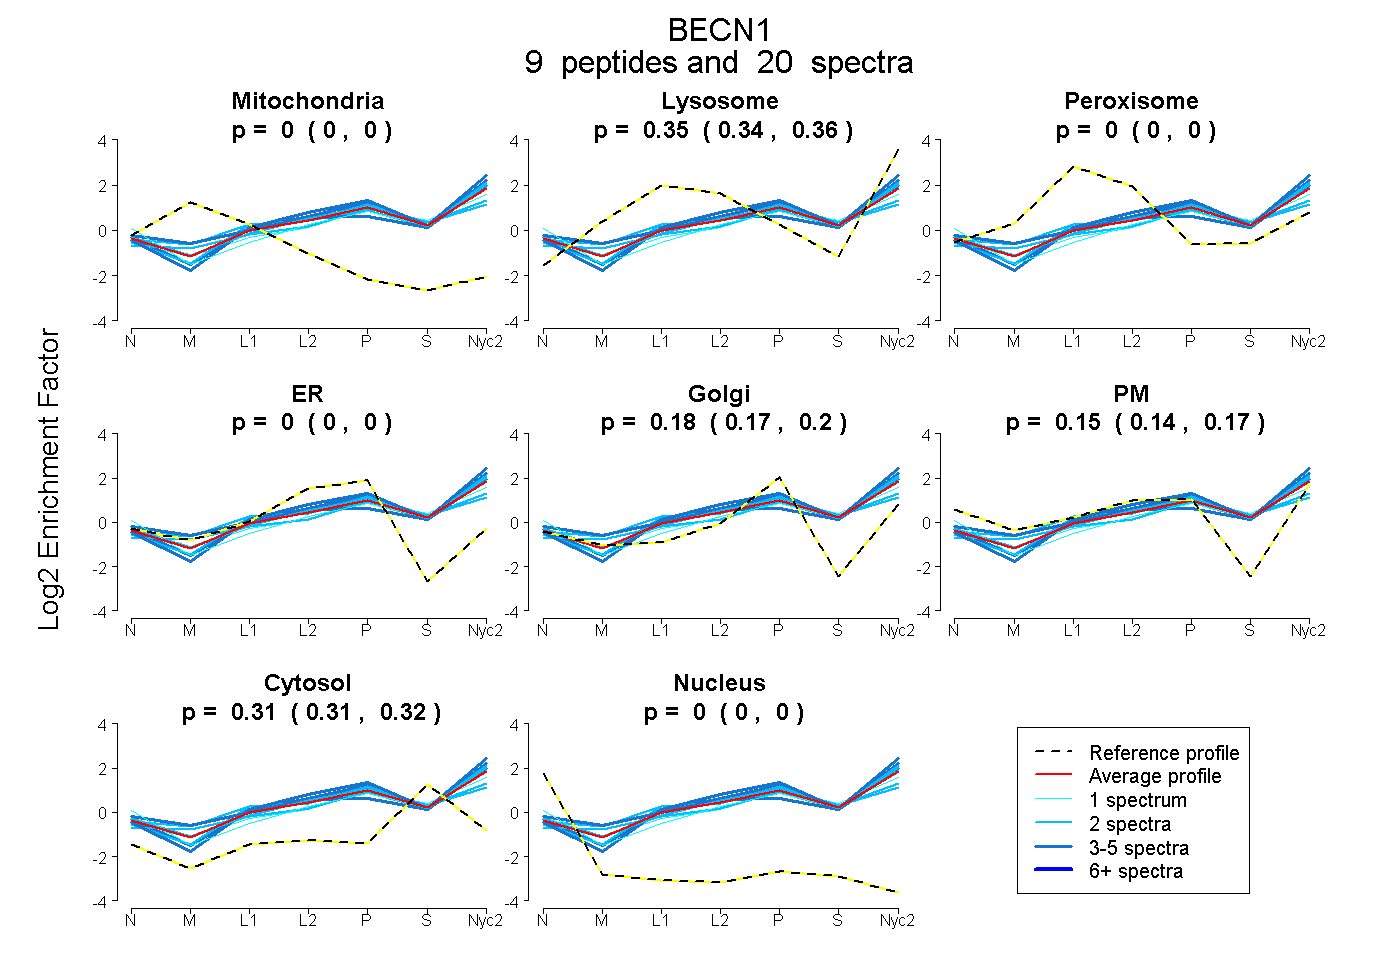
| Plot | Mito | Lyso | Perox | ER | Golgi | PM | Cytosol | Nucleus | |||||
| Expt A |
9 peptides |
20 spectra |
|
0.000 0.000 | 0.000 |
0.350 0.339 | 0.360 |
0.000 0.000 | 0.000 |
0.000 0.000 | 0.000 |
0.183 0.166 | 0.197 |
0.155 0.136 | 0.171 |
0.312 0.306 | 0.318 |
0.000 0.000 | 0.000 |
| 1 spectrum, VQAEAER | 0.000 | 0.177 | 0.000 | 0.000 | 0.057 | 0.395 | 0.371 | 0.000 | ||
| 3 spectra, ELALEEER | 0.000 | 0.389 | 0.000 | 0.000 | 0.220 | 0.117 | 0.273 | 0.000 | ||
| 2 spectra, FCLPYR | 0.000 | 0.299 | 0.034 | 0.000 | 0.311 | 0.000 | 0.355 | 0.000 | ||
| 2 spectra, ELPLYCSGGLR | 0.000 | 0.303 | 0.065 | 0.000 | 0.306 | 0.000 | 0.326 | 0.000 | ||
| 2 spectra, TQFNSEEQWTK | 0.000 | 0.343 | 0.000 | 0.000 | 0.182 | 0.186 | 0.289 | 0.000 | ||
| 1 spectrum, ASSSTMQVSFVCQR | 0.000 | 0.335 | 0.000 | 0.000 | 0.269 | 0.025 | 0.371 | 0.000 | ||
| 2 spectra, LDQEEAQYQR | 0.000 | 0.433 | 0.000 | 0.000 | 0.105 | 0.187 | 0.276 | 0.000 | ||
| 4 spectra, QQLELDDELK | 0.000 | 0.347 | 0.000 | 0.000 | 0.000 | 0.345 | 0.308 | 0.000 | ||
| 3 spectra, LIQELEDVEK | 0.000 | 0.439 | 0.000 | 0.000 | 0.278 | 0.032 | 0.252 | 0.000 |
| Plot | Lyso | Other | |||||||||||
| Expt C |
13 peptides |
29 spectra |
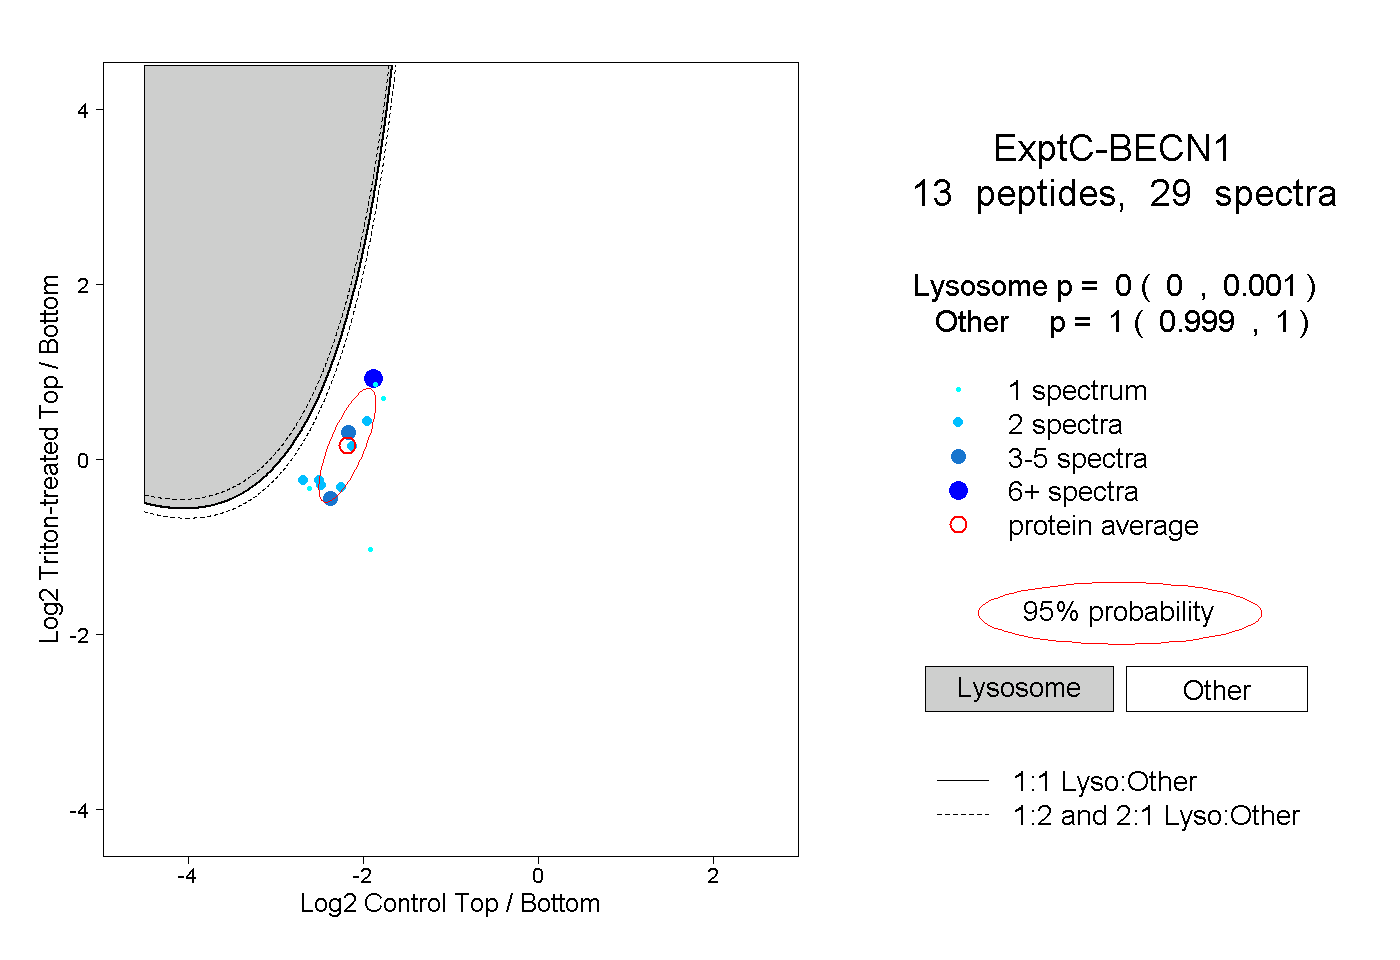 |
0.000 0.000 | 0.001 |
1.000 0.999 | 1.000 |
||||||||
| Plot | Lyso | Other | |||||||||||
| Expt D |
3 peptides |
4 spectra |
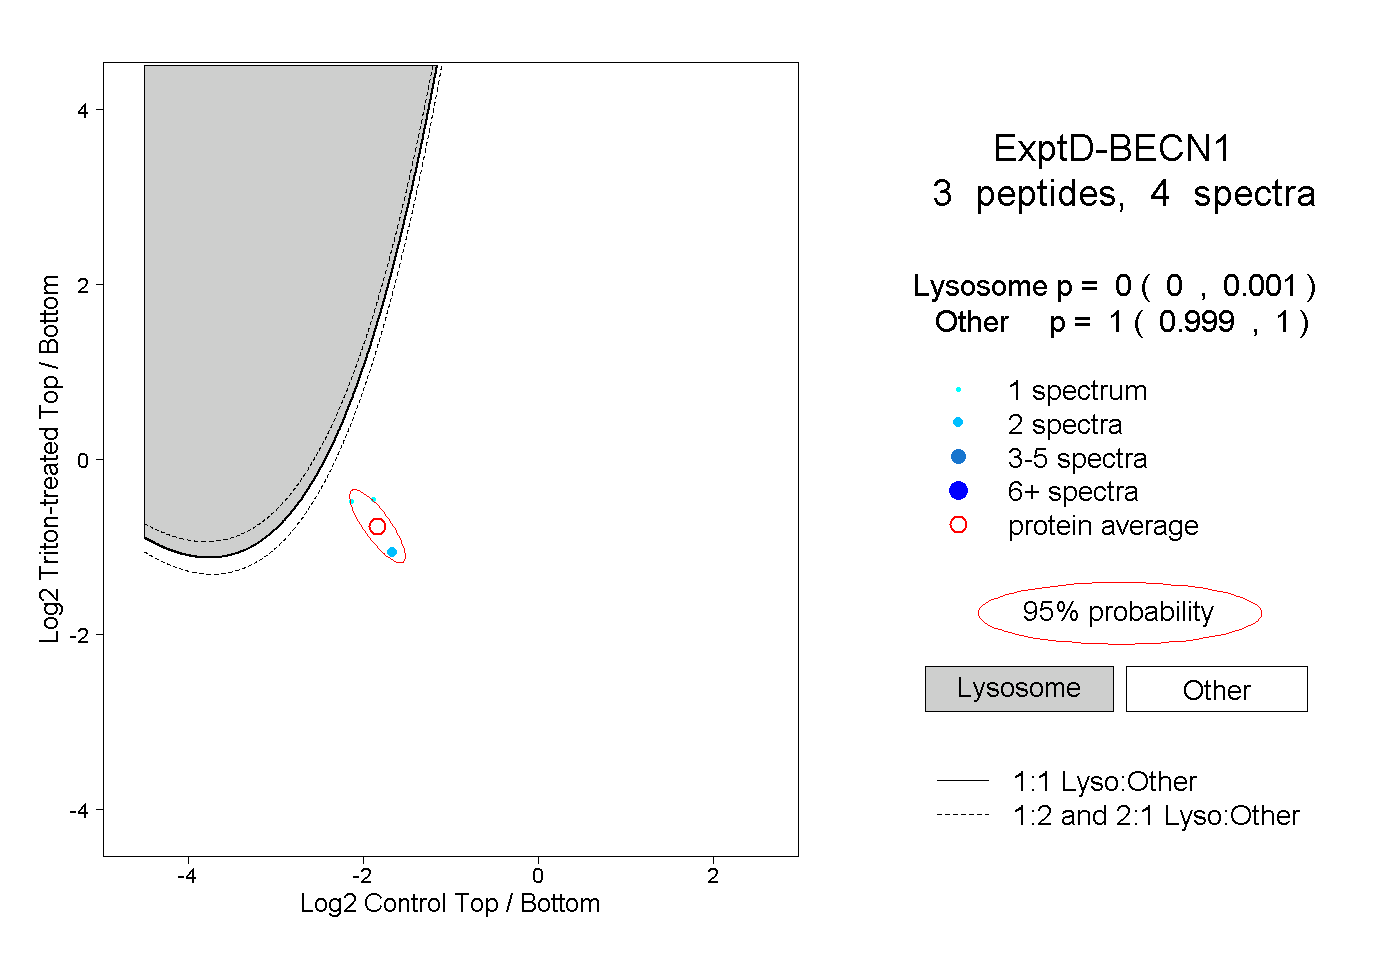 |
0.000 0.000 | 0.001 |
1.000 0.999 | 1.000 |