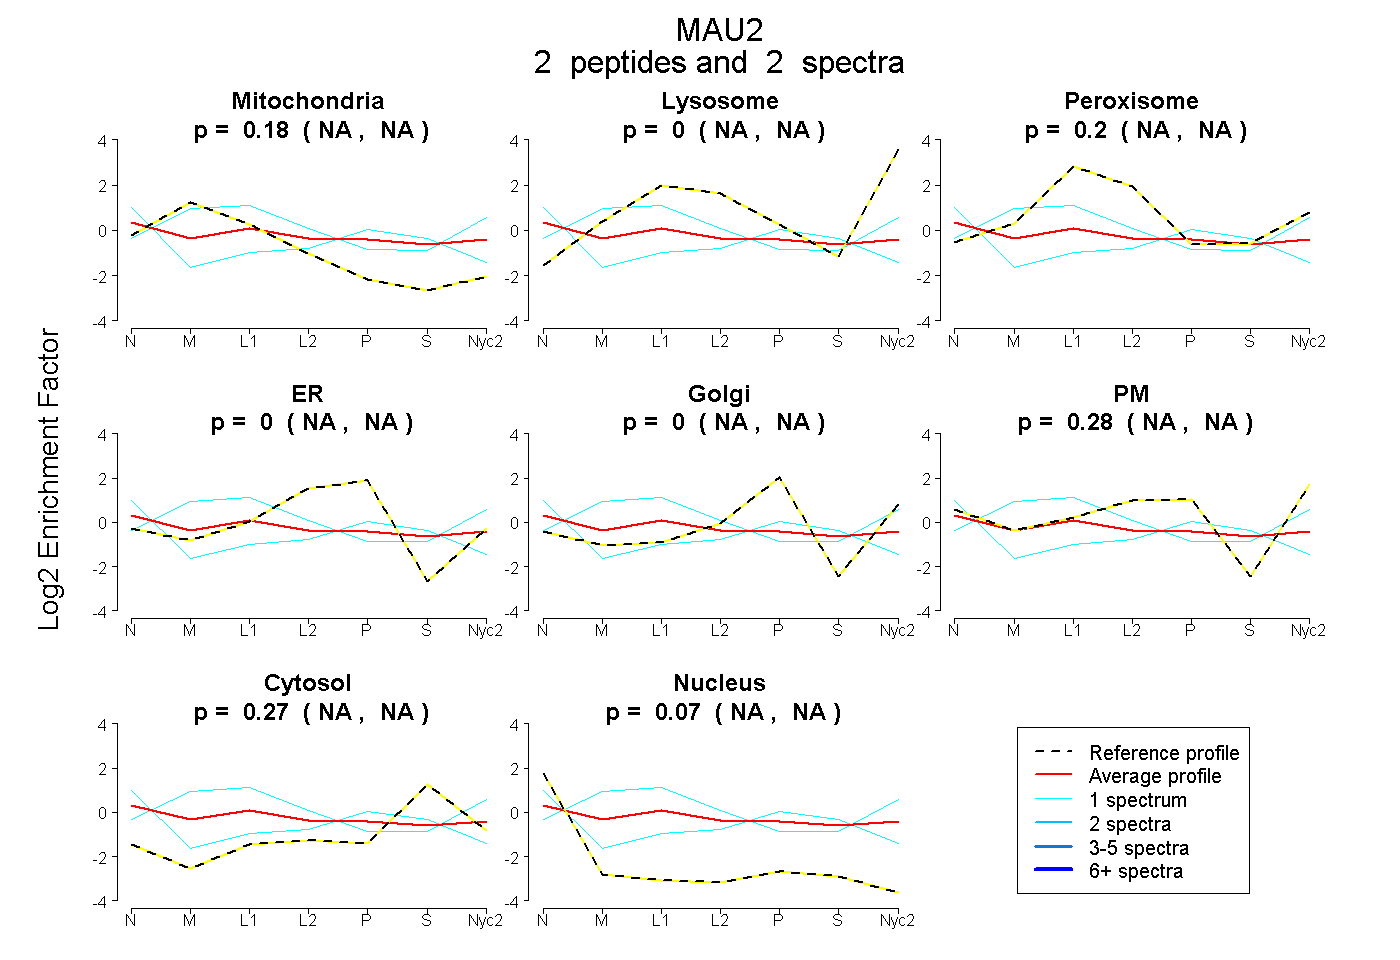
 2
2peptides
spectra
NA | NA
NA | NA
NA | NA
NA | NA
NA | NA
NA | NA
NA | NA
NA | NA
| Plot | Mito | Lyso | Perox | ER | Golgi | PM | Cytosol | Nucleus | |||||
| Expt A |
2 peptides |
2 spectra |
|
0.178 NA | NA |
0.000 NA | NA |
0.198 NA | NA |
0.000 NA | NA |
0.000 NA | NA |
0.277 NA | NA |
0.273 NA | NA |
0.075 NA | NA |
| 1 spectrum, ATALQEISQVCQLCQQSPR | 0.382 | 0.308 | 0.208 | 0.000 | 0.000 | 0.011 | 0.090 | 0.000 | ||
| 1 spectrum, LVTGHK | 0.000 | 0.000 | 0.055 | 0.238 | 0.000 | 0.103 | 0.349 | 0.255 |
| Plot | Lyso | Other | |||||||||||
| Expt C |
1 peptide |
3 spectra |
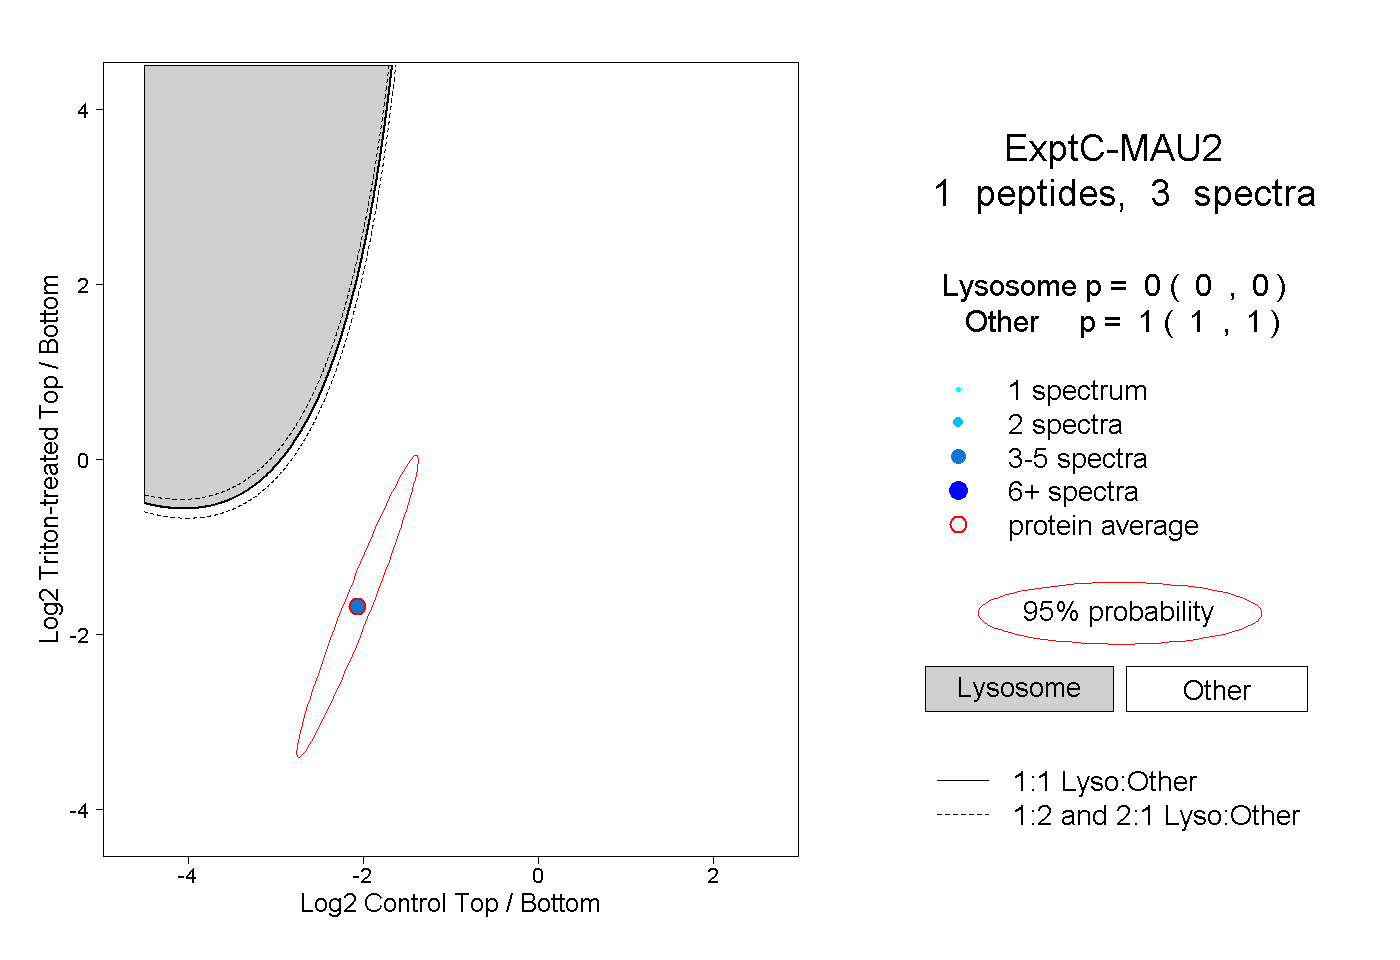 |
0.000 0.000 | 0.000 |
1.000 1.000 | 1.000 |