 3
3peptides
spectra
0.000 | 0.059
0.000 | 0.000
0.000 | 0.070
0.000 | 0.227
0.000 | 0.244
0.000 | 0.235
0.317 | 0.428
0.277 | 0.437
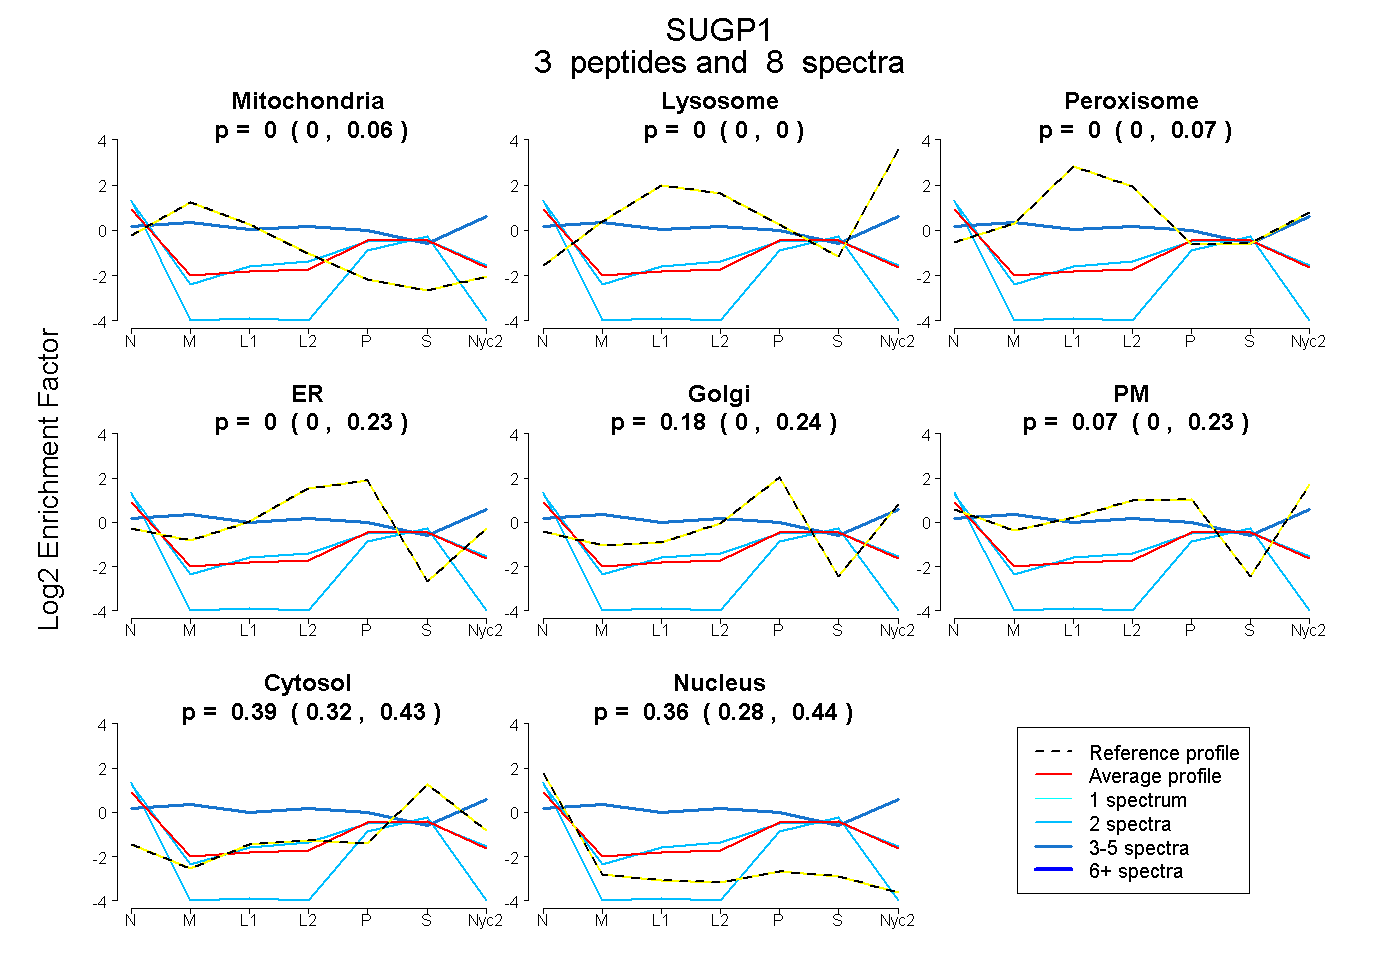
| Plot | Mito | Lyso | Perox | ER | Golgi | PM | Cytosol | Nucleus | |||||
| Expt A |
3 peptides |
8 spectra |
|
0.000 0.000 | 0.059 |
0.000 0.000 | 0.000 |
0.000 0.000 | 0.070 |
0.000 0.000 | 0.227 |
0.182 0.000 | 0.244 |
0.067 0.000 | 0.235 |
0.390 0.317 | 0.428 |
0.361 0.277 | 0.437 |
| 2 spectra, EDDEYEAFR | 0.000 | 0.000 | 0.000 | 0.000 | 0.000 | 0.000 | 0.238 | 0.762 | ||
| 2 spectra, FRPNPLNNPR | 0.000 | 0.000 | 0.000 | 0.063 | 0.000 | 0.188 | 0.383 | 0.365 | ||
| 4 spectra, LEEFR | 0.152 | 0.048 | 0.146 | 0.000 | 0.000 | 0.429 | 0.225 | 0.000 |