 2
2peptides
spectra
0.000 | 0.000
0.000 | 0.000
0.000 | 0.018
0.000 | 0.004
0.033 | 0.076
0.216 | 0.282
0.574 | 0.594
0.087 | 0.103
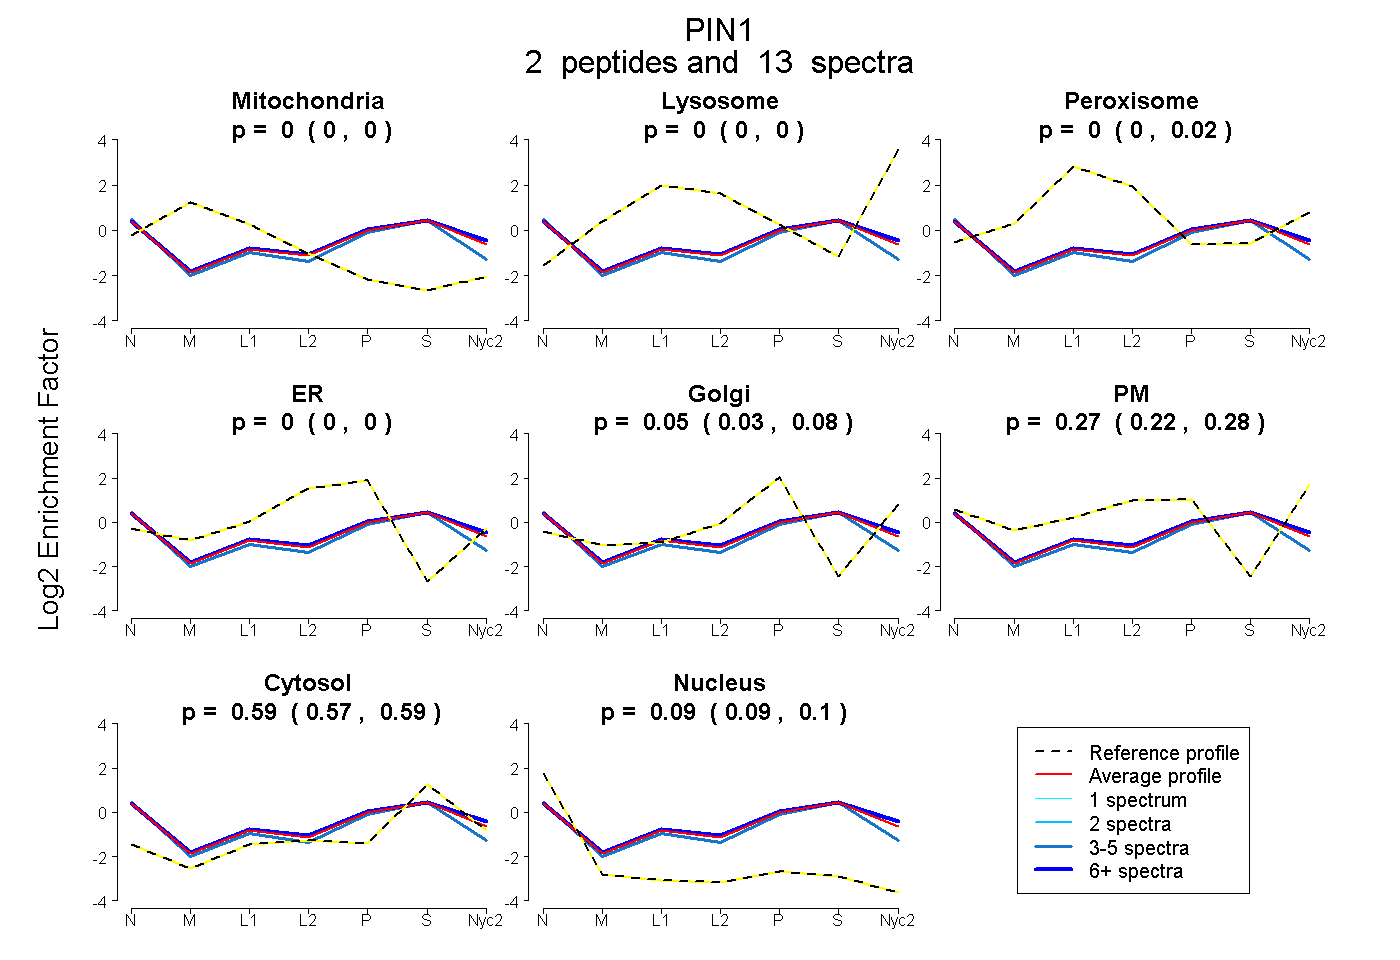
| Plot | Mito | Lyso | Perox | ER | Golgi | PM | Cytosol | Nucleus | |||||
| Expt A |
2 peptides |
13 spectra |
|
0.000 0.000 | 0.000 |
0.000 0.000 | 0.000 |
0.000 0.000 | 0.018 |
0.000 0.000 | 0.004 |
0.051 0.033 | 0.076 |
0.266 0.216 | 0.282 |
0.589 0.574 | 0.594 |
0.094 0.087 | 0.103 |
| 3 spectra, GQMQKPFEDASFALR | 0.000 | 0.000 | 0.052 | 0.072 | 0.121 | 0.025 | 0.555 | 0.175 | ||
| 10 spectra, RPSSWR | 0.000 | 0.000 | 0.000 | 0.000 | 0.034 | 0.302 | 0.590 | 0.073 |
| Plot | Lyso | Other | |||||||||||
| Expt C |
2 peptides |
3 spectra |
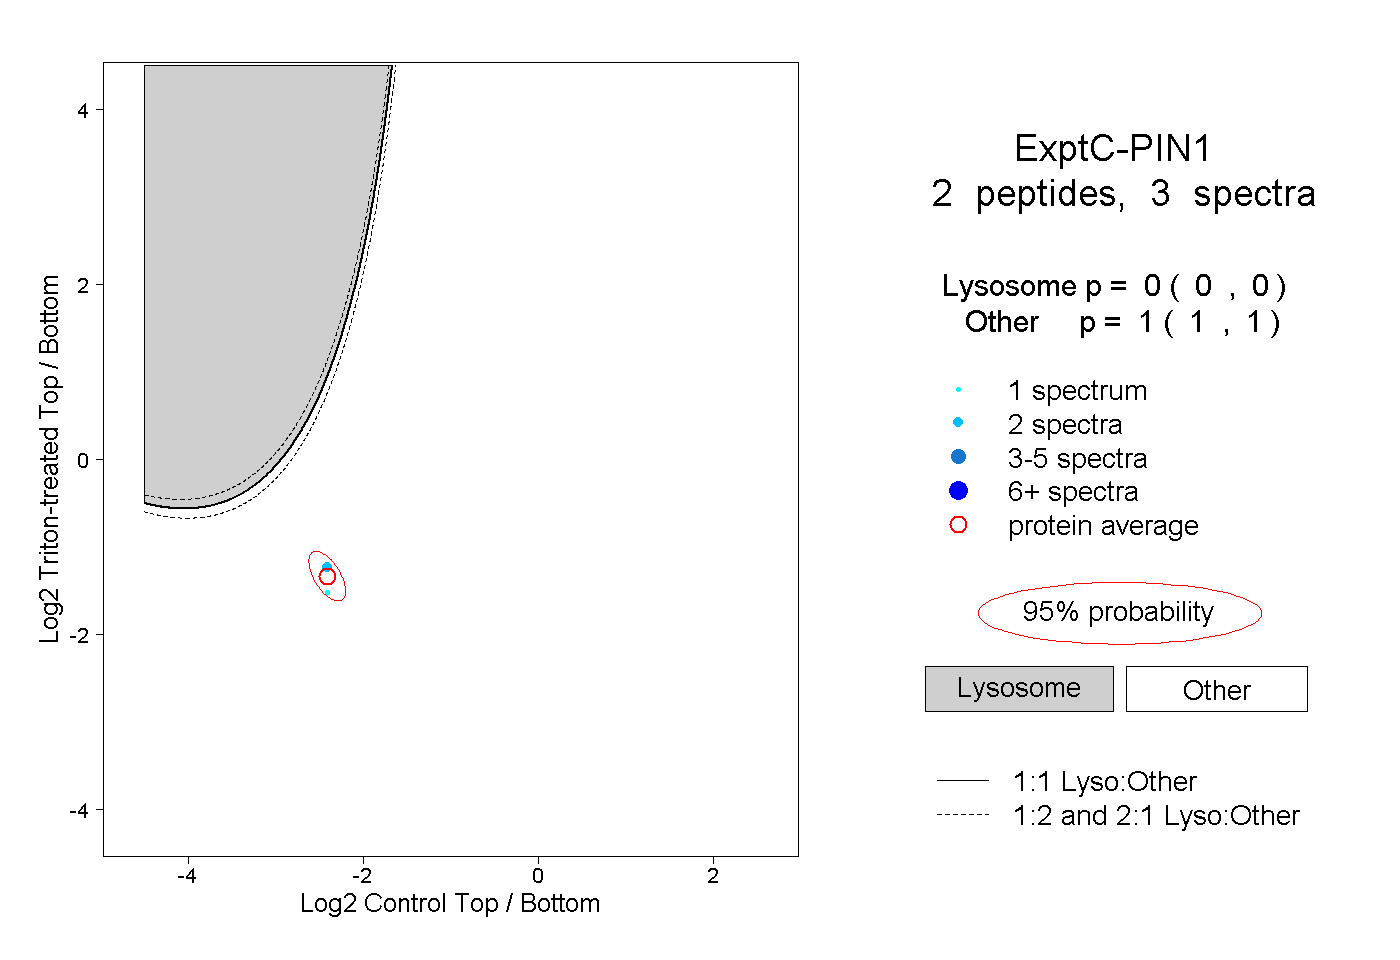 |
0.000 0.000 | 0.000 |
1.000 1.000 | 1.000 |