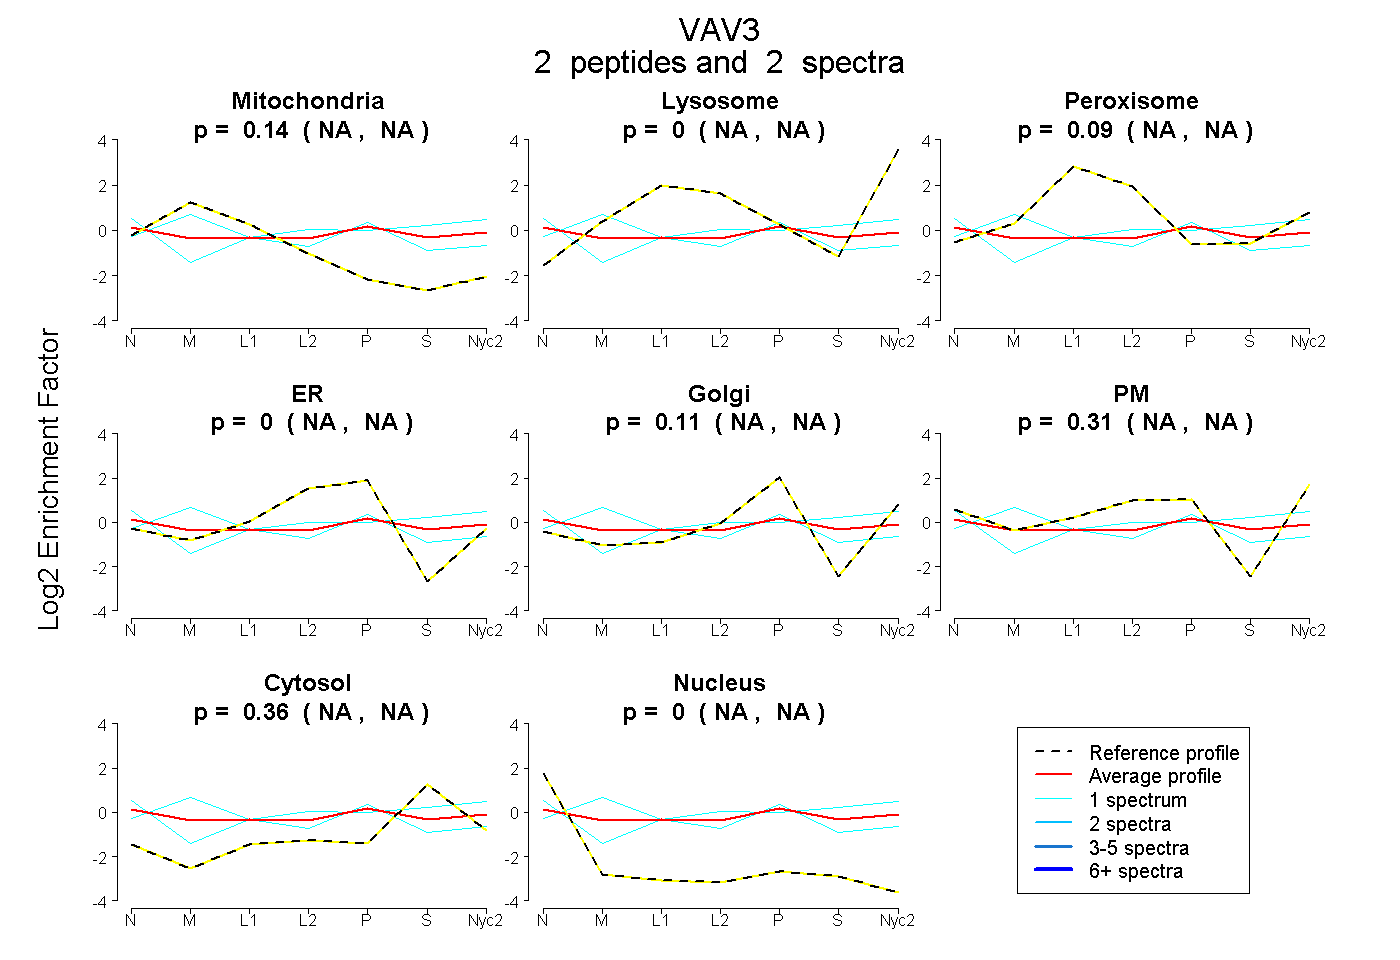
 2
2peptides
spectra
NA | NA
NA | NA
NA | NA
NA | NA
NA | NA
NA | NA
NA | NA
NA | NA
| Plot | Mito | Lyso | Perox | ER | Golgi | PM | Cytosol | Nucleus | |||||
| Expt A |
2 peptides |
2 spectra |
|
0.136 NA | NA |
0.000 NA | NA |
0.087 NA | NA |
0.000 NA | NA |
0.108 NA | NA |
0.312 NA | NA |
0.356 NA | NA |
0.000 NA | NA |
| 1 spectrum, DGFFHIAENR | 0.366 | 0.000 | 0.100 | 0.000 | 0.381 | 0.000 | 0.153 | 0.000 | ||
| 1 spectrum, AEEAHQAK | 0.000 | 0.000 | 0.078 | 0.000 | 0.000 | 0.445 | 0.478 | 0.000 |
| Plot | Lyso | Other | |||||||||||
| Expt C |
1 peptide |
4 spectra |
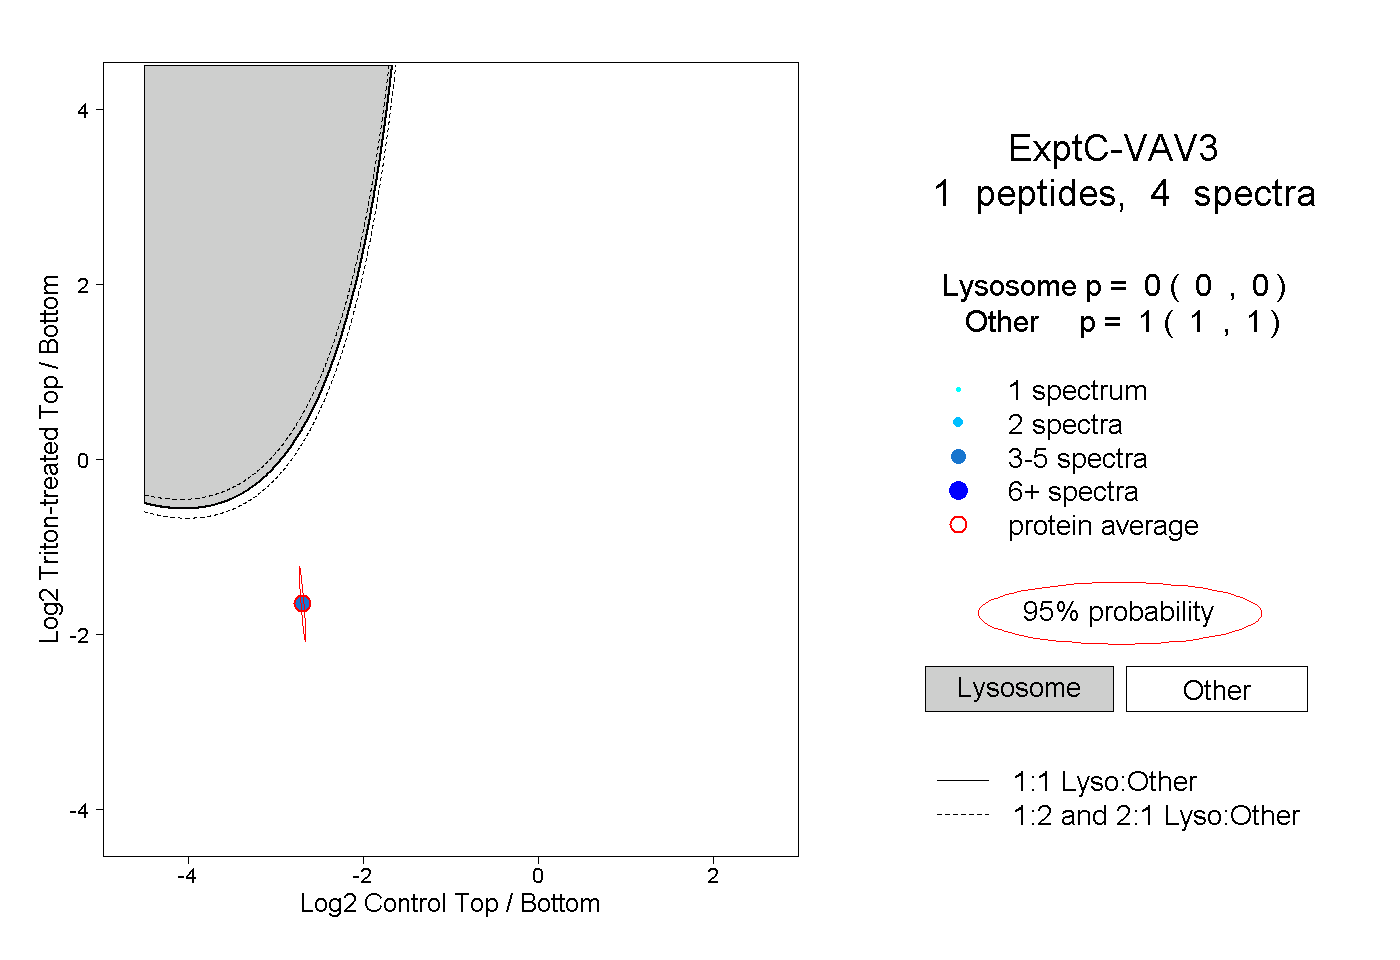 |
0.000 0.000 | 0.000 |
1.000 1.000 | 1.000 |