 9
9peptides
spectra
0.000 | 0.000
0.000 | 0.000
0.000 | 0.000
0.092 | 0.208
0.000 | 0.112
0.000 | 0.000
0.287 | 0.317
0.467 | 0.500
1peptide
spectrum
NA | NA
NA | NA
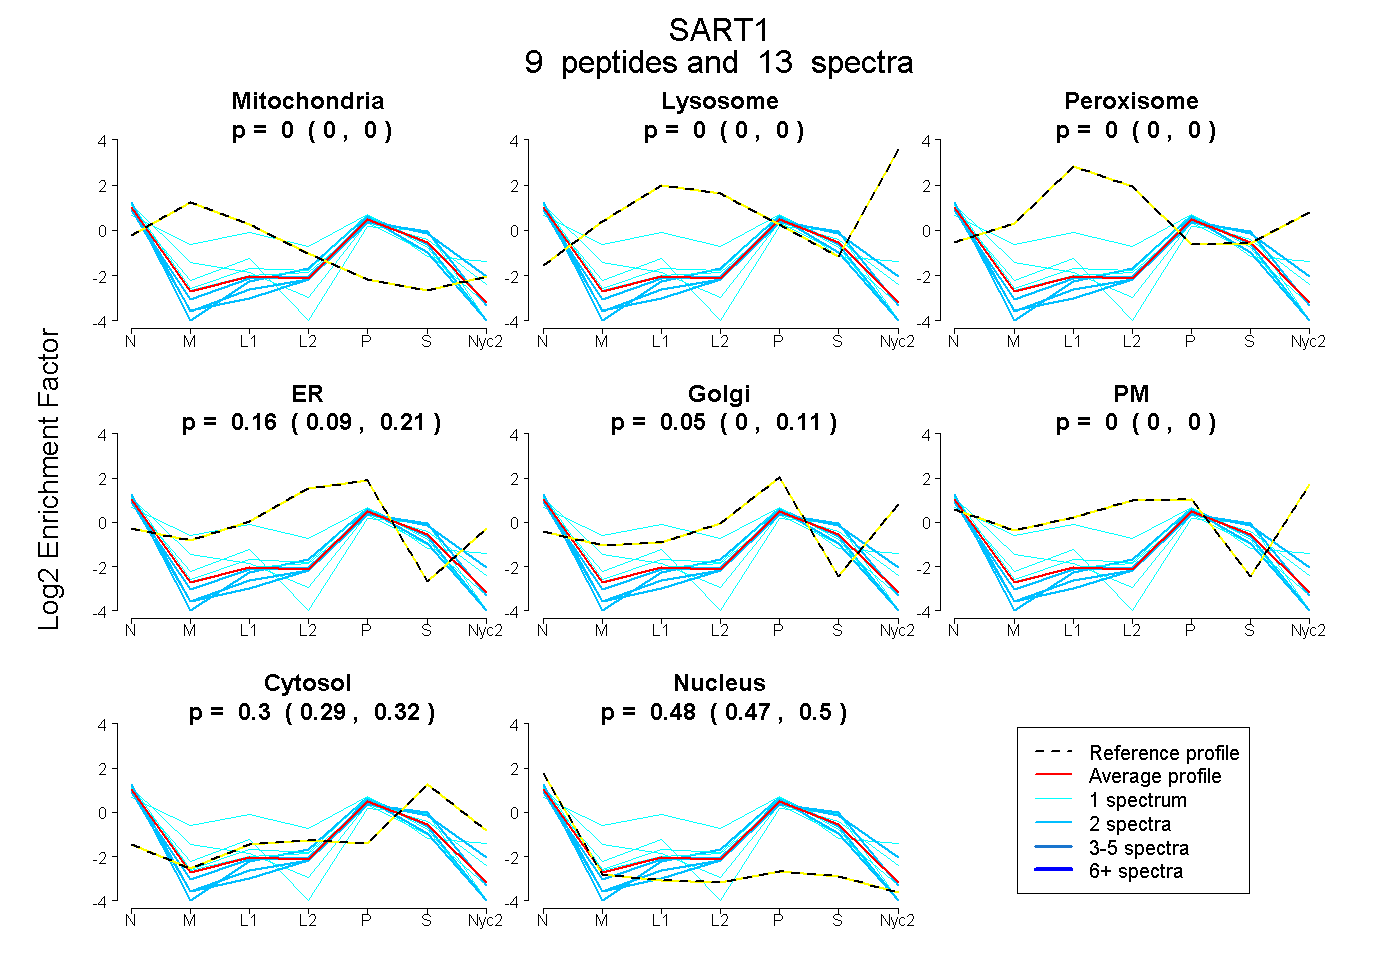
| Plot | Mito | Lyso | Perox | ER | Golgi | PM | Cytosol | Nucleus | |||||
| Expt A |
9 peptides |
13 spectra |
|
0.000 0.000 | 0.000 |
0.000 0.000 | 0.000 |
0.000 0.000 | 0.000 |
0.162 0.092 | 0.208 |
0.049 0.000 | 0.112 |
0.000 0.000 | 0.000 |
0.304 0.287 | 0.317 |
0.485 0.467 | 0.500 |
||
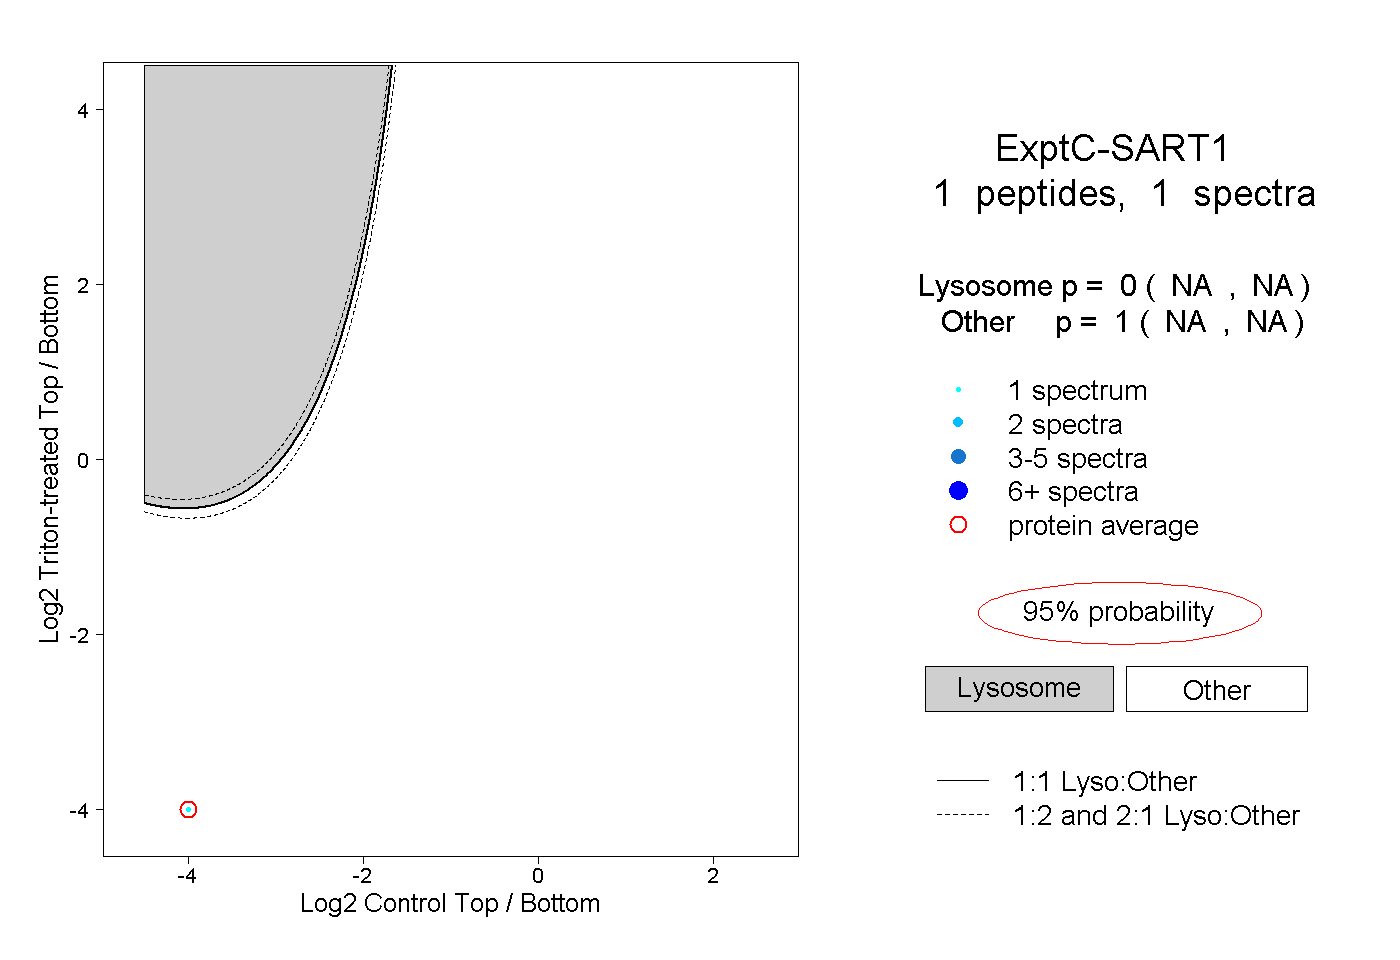
| Plot | Lyso | Other | |||||||||||
| Expt C |
1 peptide |
1 spectrum |
|
0.000 NA | NA |
1.000 NA | NA |