6
6peptides
spectra
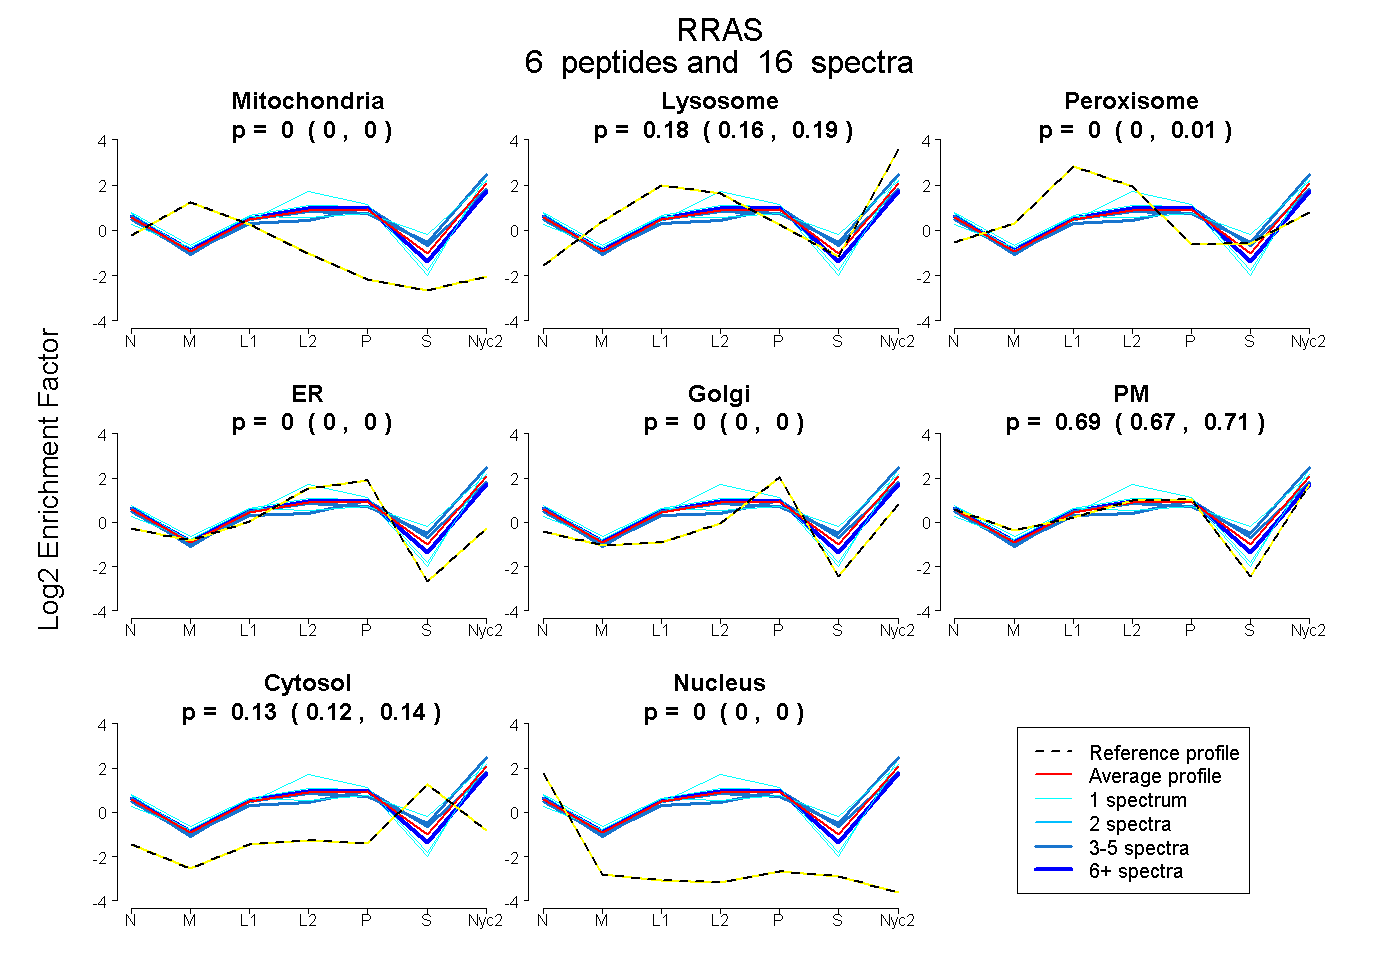
0.000 | 0.000
0.163 | 0.195
0.000 | 0.010
0.000 | 0.000
0.000 | 0.000
0.666 | 0.707
0.117 | 0.140
0.000 | 0.000
5peptides
spectra
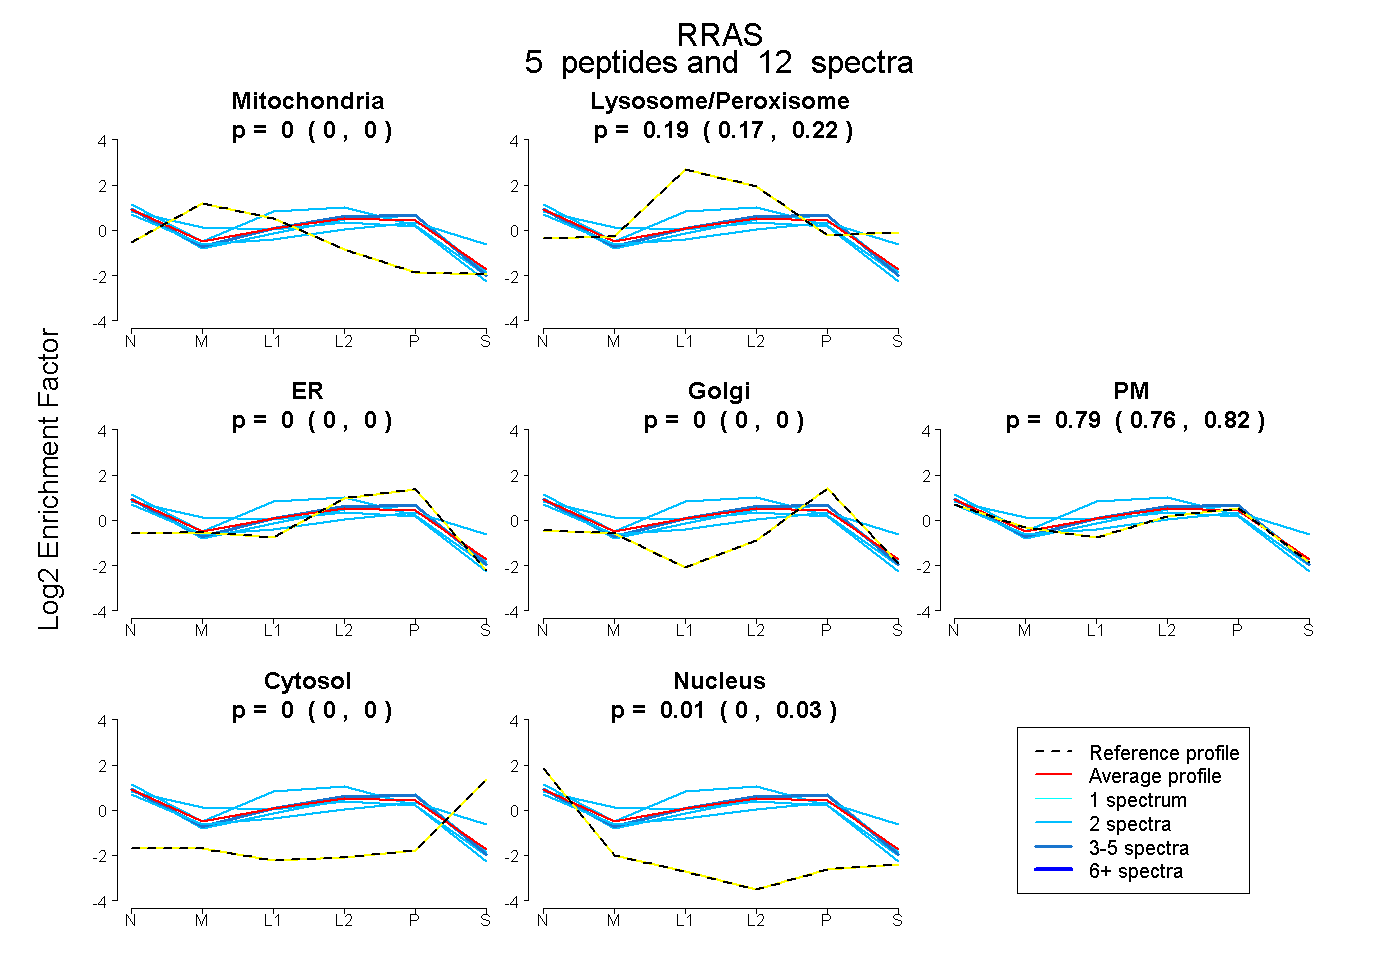
0.000 | 0.000
0.166 | 0.217
0.000 | 0.000
0.000 | 0.000
0.756 | 0.824
0.000 | 0.000
0.000 | 0.026
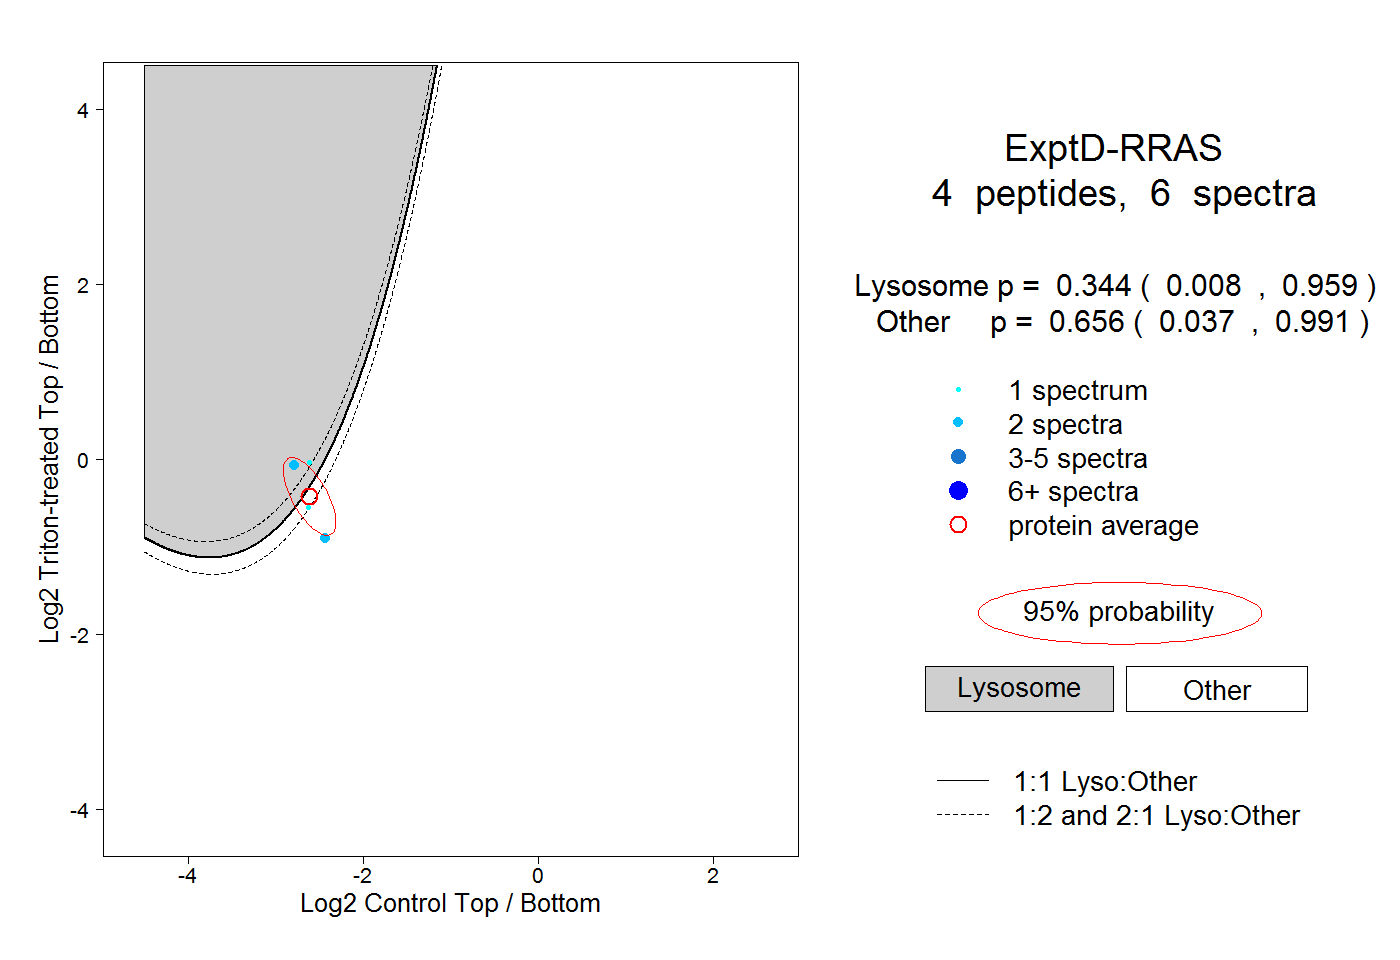
7peptides
spectra
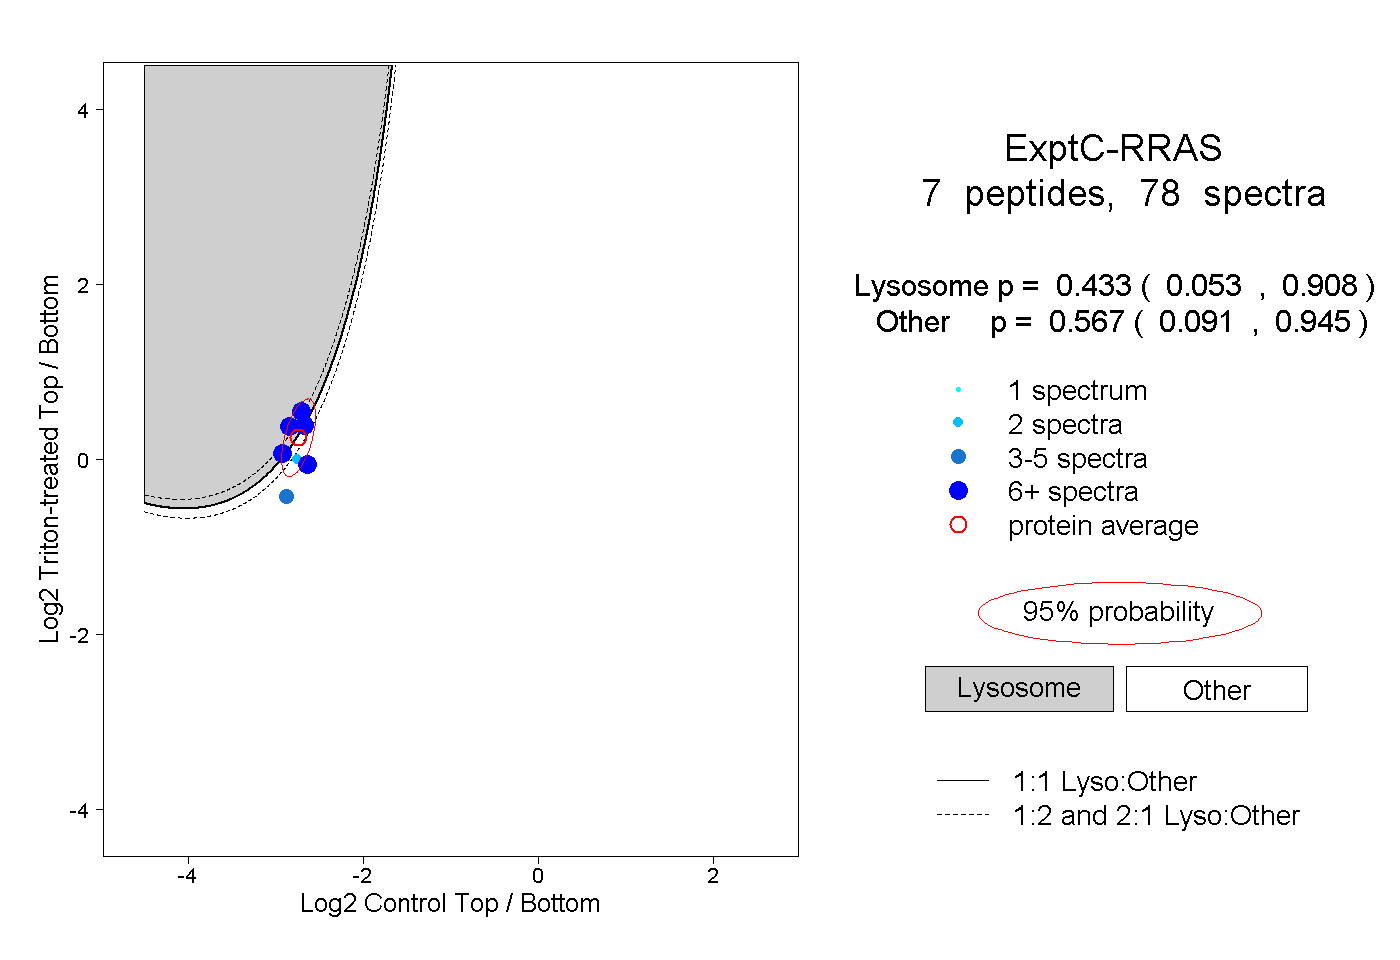
0.053 | 0.908
0.091 | 0.945