RRAS
[ENSRNOP00000027809]
Main page
| | | Plot |
Mito |
Lyso |
|
Perox |
ER |
Golgi |
PM |
Cytosol |
Nucleus |
|
| Expt A |
 6
6
peptides |
16
spectra |
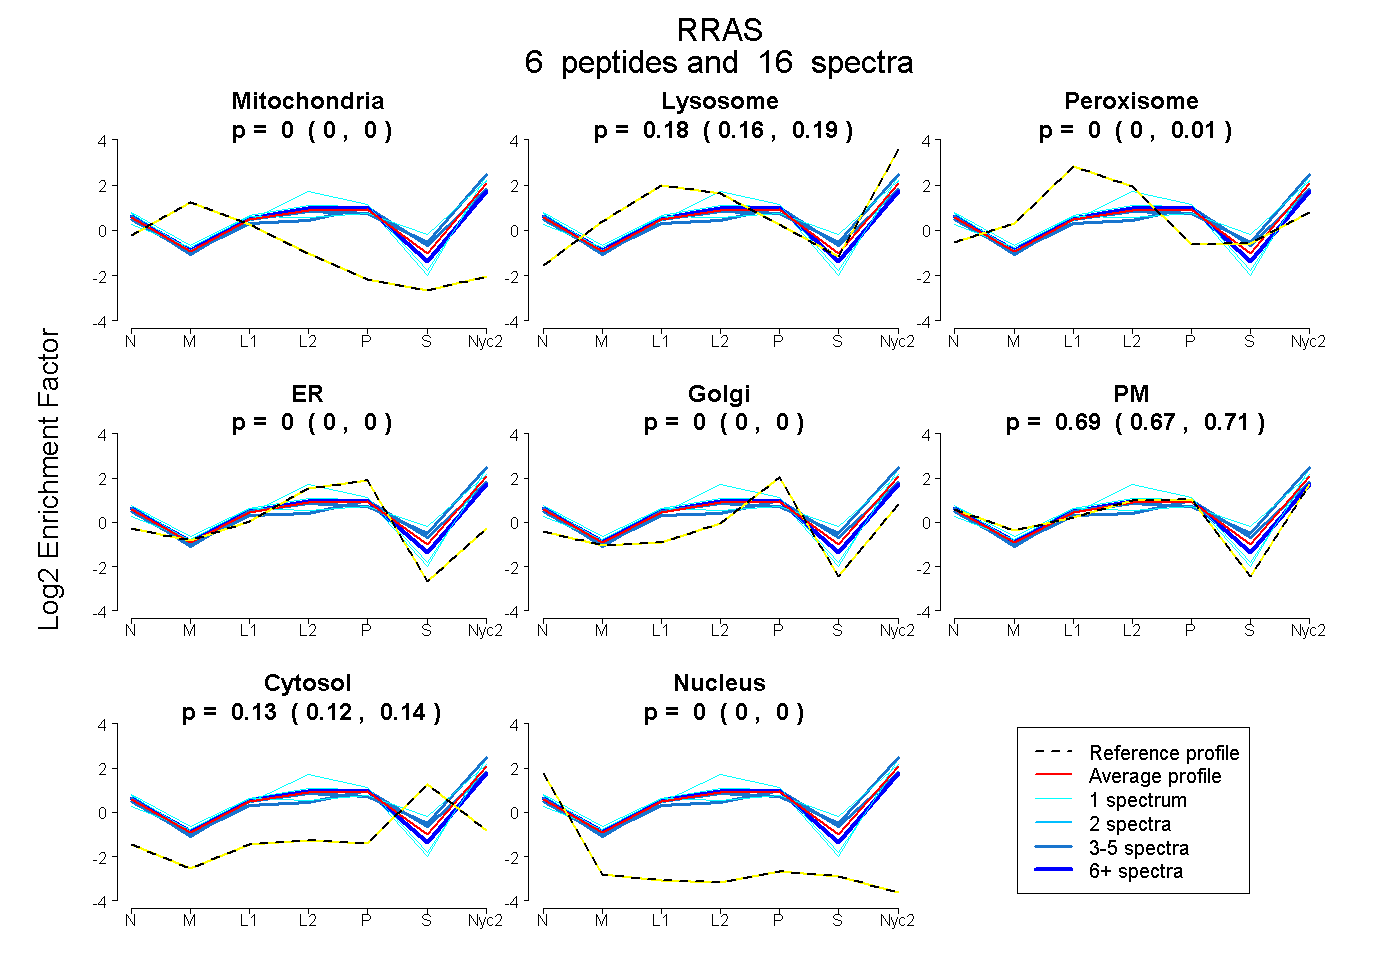 |
0.000
0.000 | 0.000 |
0.182
0.163 | 0.195 |
|
0.000
0.000 | 0.010 |
0.000
0.000 | 0.000 |
0.000
0.000 | 0.000 |
0.689
0.666 | 0.707 |
0.129
0.117 | 0.140 |
0.000
0.000 | 0.000 |
|
| | | Plot |
Mito |
|
Lyso or Perox |
|
ER |
Golgi |
PM |
Cytosol |
Nucleus |
|
| Expt B |
5
peptides |
12
spectra |
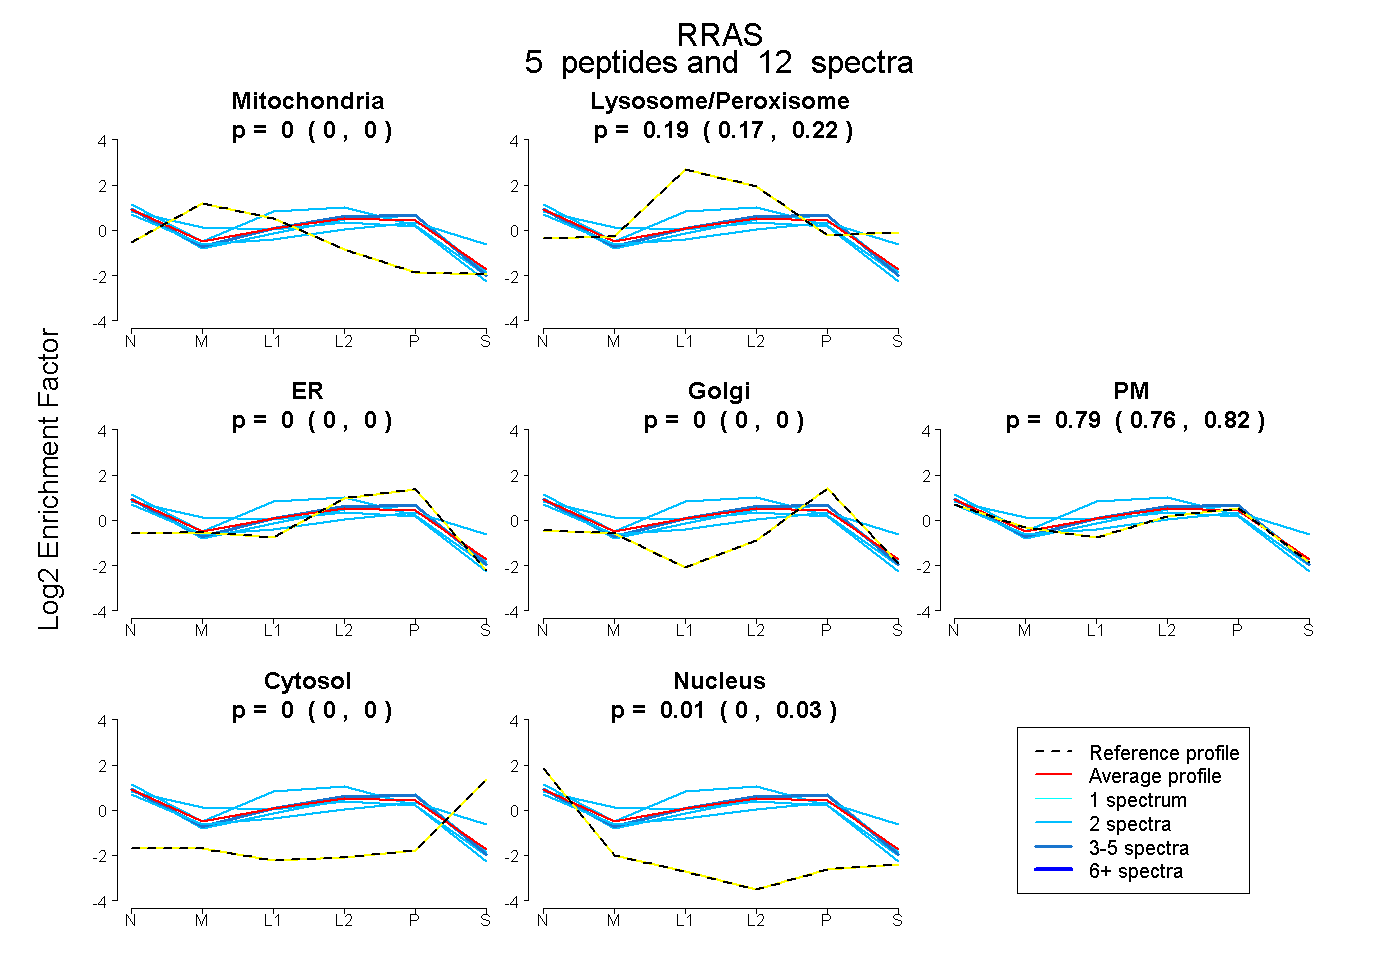 |
0.000
0.000 | 0.000 |
|
0.193
0.166 | 0.217 |
|
0.000
0.000 | 0.000 |
0.000
0.000 | 0.000 |
0.794
0.756 | 0.824 |
0.000
0.000 | 0.000 |
0.013
0.000 | 0.026 |
|
| 2 spectra, LFTQILR |
0.000 |
|
0.334 |
|
0.000 |
0.000 |
0.666 |
0.000 |
0.000 |
|
| 2 spectra, ICTVDGIPAR |
0.136 |
|
0.094 |
|
0.000 |
0.000 |
0.771 |
0.000 |
0.000 |
|
| 4 spectra, LNVDEAFEQLVR |
0.000 |
|
0.161 |
|
0.015 |
0.000 |
0.824 |
0.000 |
0.000 |
|
| 2 spectra, ADLETQR |
0.000 |
|
0.122 |
|
0.000 |
0.000 |
0.878 |
0.000 |
0.000 |
|
| 2 spectra, LVVVGGGGVGK |
0.000 |
|
0.168 |
|
0.000 |
0.000 |
0.685 |
0.146 |
0.001 |
|
| | | Plot |
|
Lyso |
|
|
|
|
|
|
|
Other |
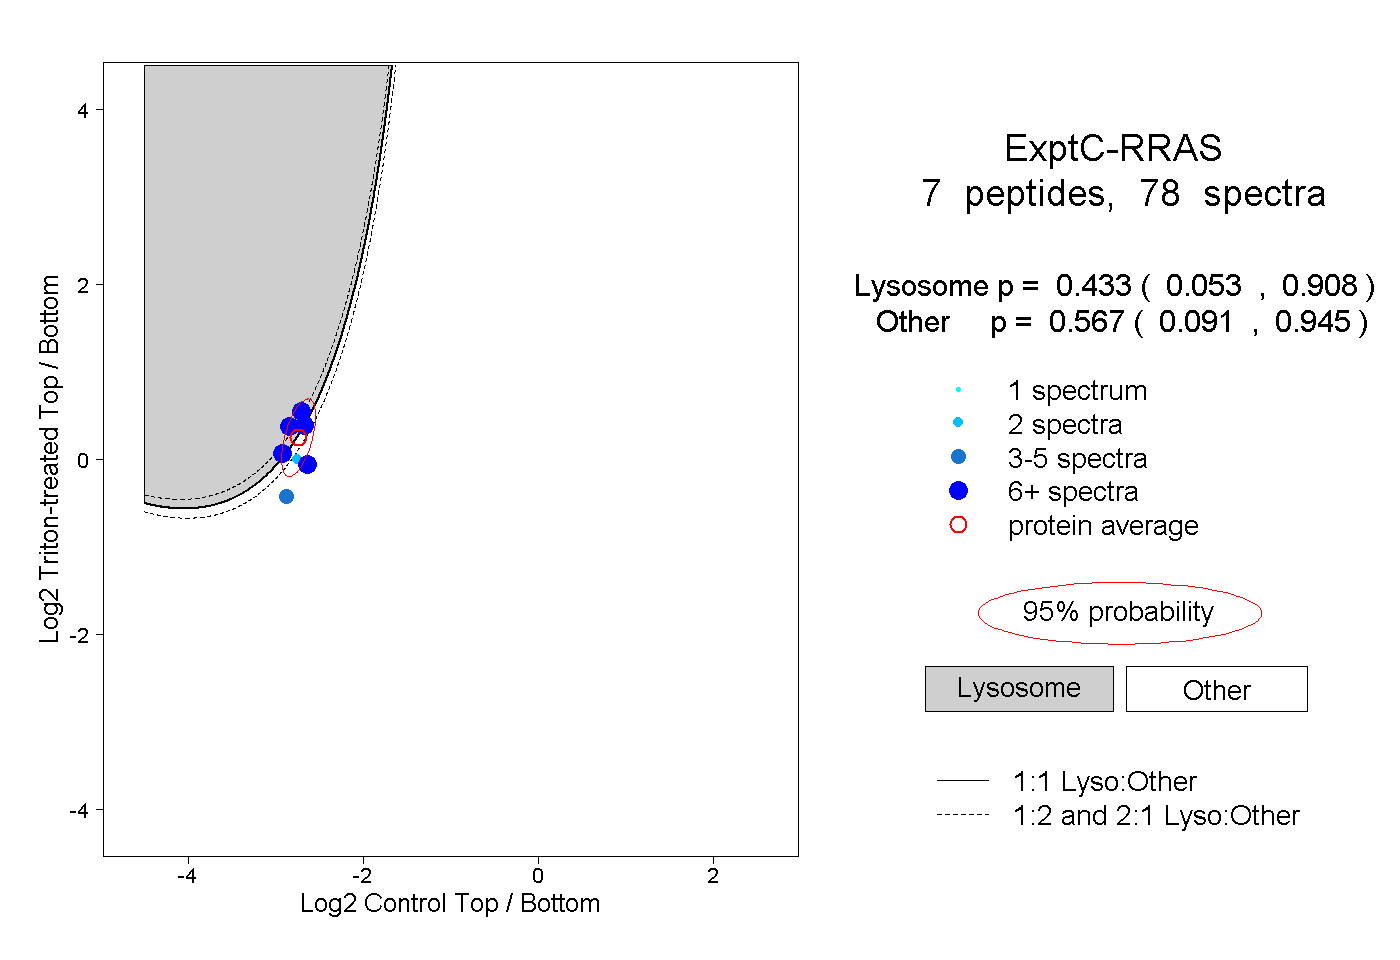
| Expt C |
7
peptides |
78
spectra |
 |
|
0.433
0.053 | 0.908 |
|
|
|
|
|
|
|
0.567
0.091 | 0.945 |
| | | Plot |
|
Lyso |
|
|
|
|
|
|
|
Other |
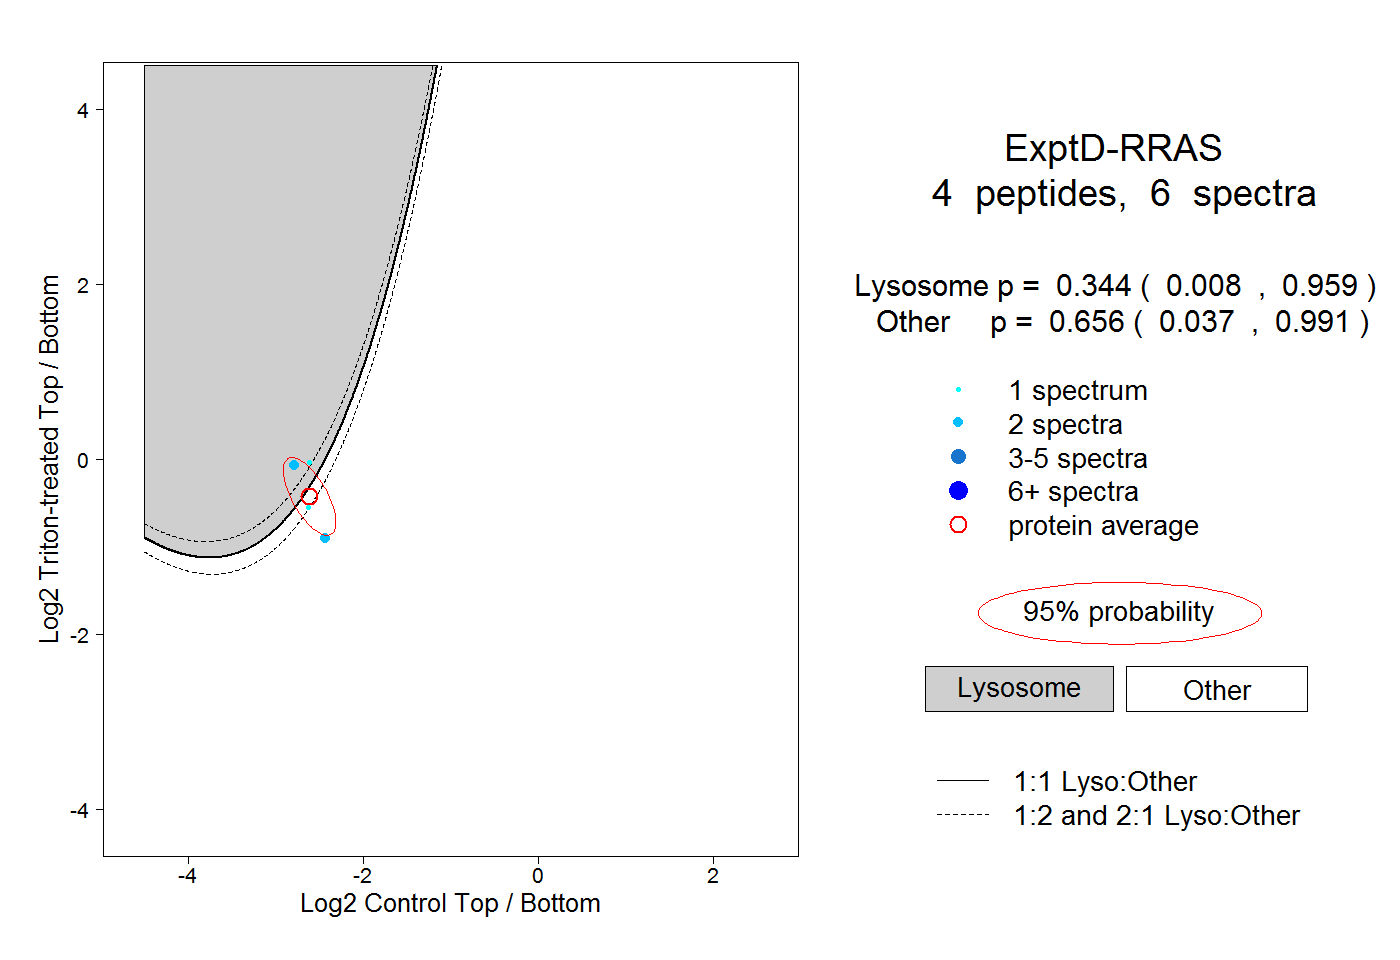
| Expt D |
4
peptides |
6
spectra |
 |
|
0.344
0.008 | 0.959 |
|
|
|
|
|
|
|
0.656
0.037 | 0.991 |