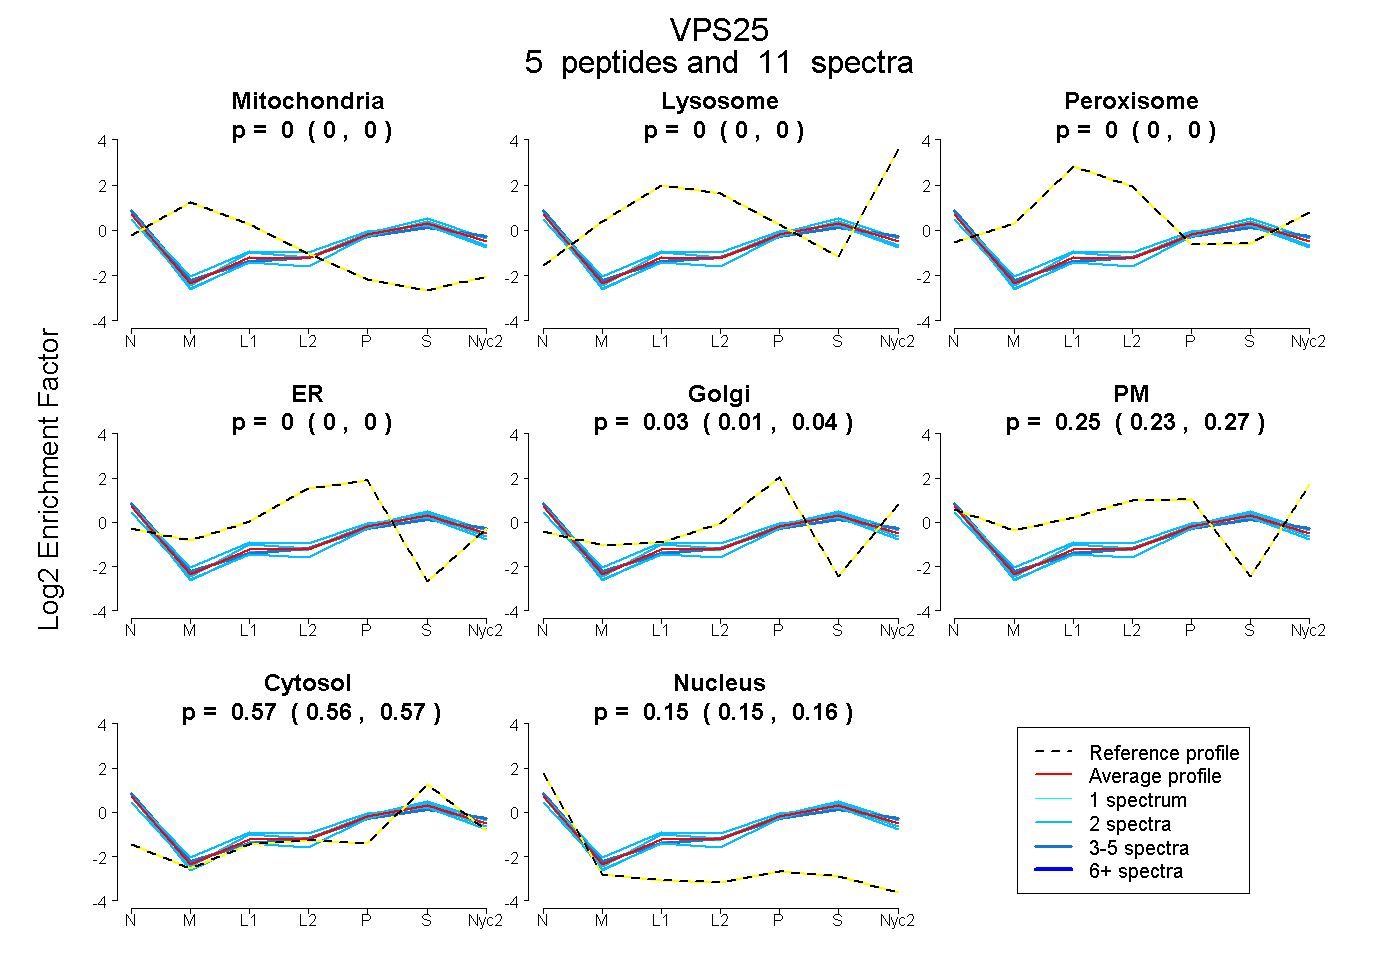
 5
5peptides
spectra
0.000 | 0.000
0.000 | 0.000
0.000 | 0.000
0.000 | 0.000
0.006 | 0.043
0.232 | 0.271
0.559 | 0.575
0.146 | 0.158
| Plot | Mito | Lyso | Perox | ER | Golgi | PM | Cytosol | Nucleus | |||||
| Expt A |
5 peptides |
11 spectra |
|
0.000 0.000 | 0.000 |
0.000 0.000 | 0.000 |
0.000 0.000 | 0.000 |
0.000 0.000 | 0.000 |
0.028 0.006 | 0.043 |
0.252 0.232 | 0.271 |
0.567 0.559 | 0.575 |
0.152 0.146 | 0.158 |
| 2 spectra, SSFLIMWR | 0.000 | 0.000 | 0.000 | 0.000 | 0.080 | 0.159 | 0.588 | 0.174 | ||
| 2 spectra, AEIITVSDGR | 0.000 | 0.000 | 0.000 | 0.000 | 0.056 | 0.205 | 0.565 | 0.175 | ||
| 3 spectra, LIYQWVSR | 0.000 | 0.000 | 0.000 | 0.000 | 0.000 | 0.308 | 0.522 | 0.170 | ||
| 2 spectra, RPEEWGK | 0.000 | 0.000 | 0.000 | 0.034 | 0.000 | 0.287 | 0.535 | 0.145 | ||
| 2 spectra, GNLEWLDK | 0.000 | 0.000 | 0.000 | 0.000 | 0.031 | 0.246 | 0.627 | 0.095 |
| Plot | Lyso | Other | |||||||||||
| Expt C |
4 peptides |
9 spectra |
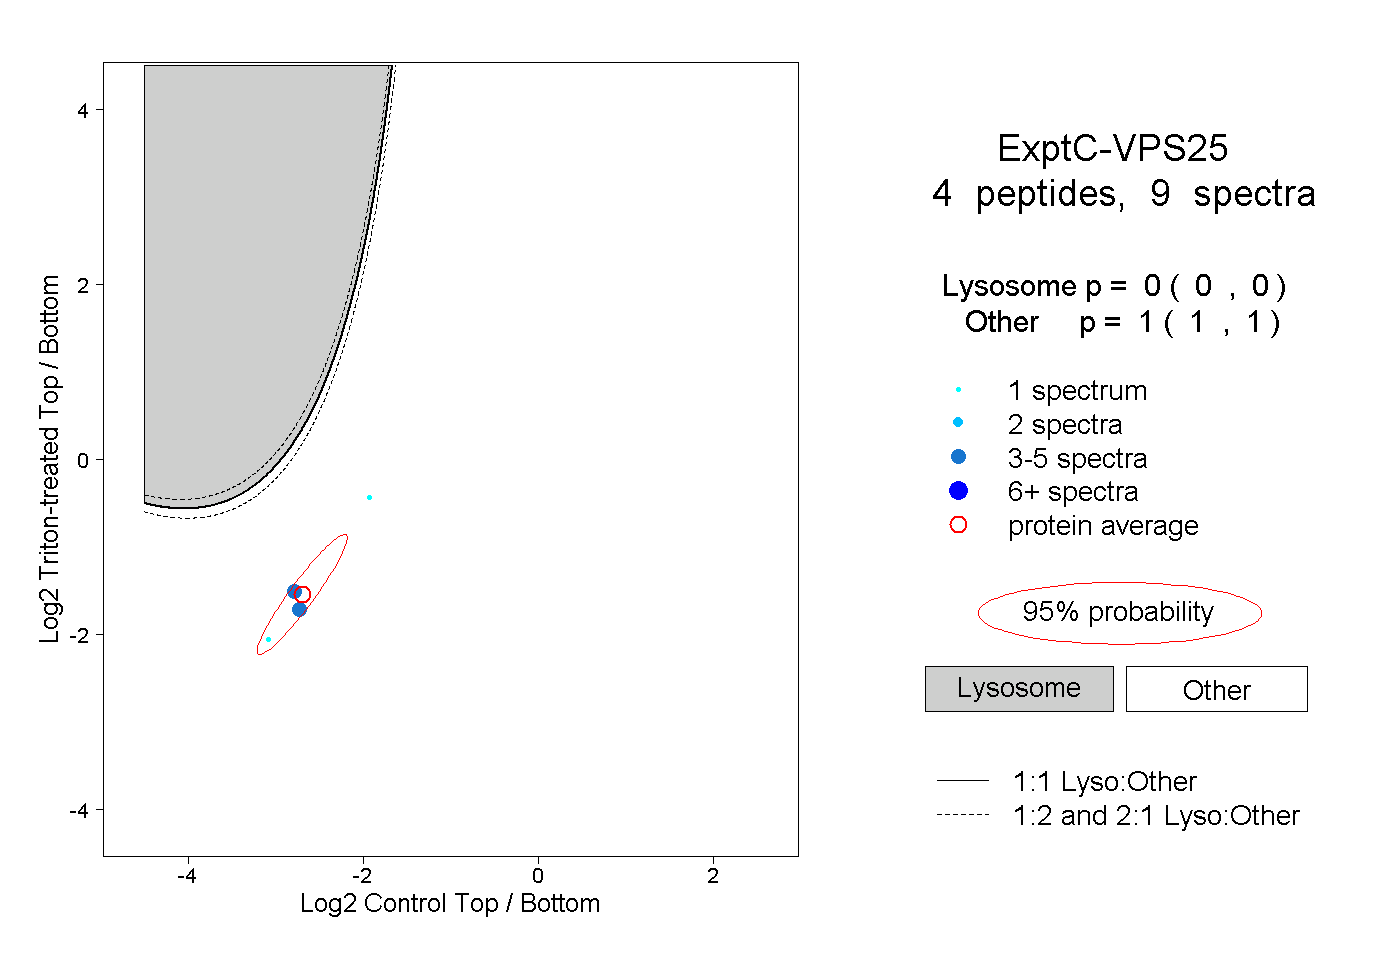 |
0.000 0.000 | 0.000 |
1.000 1.000 | 1.000 |