10
10peptides
spectra
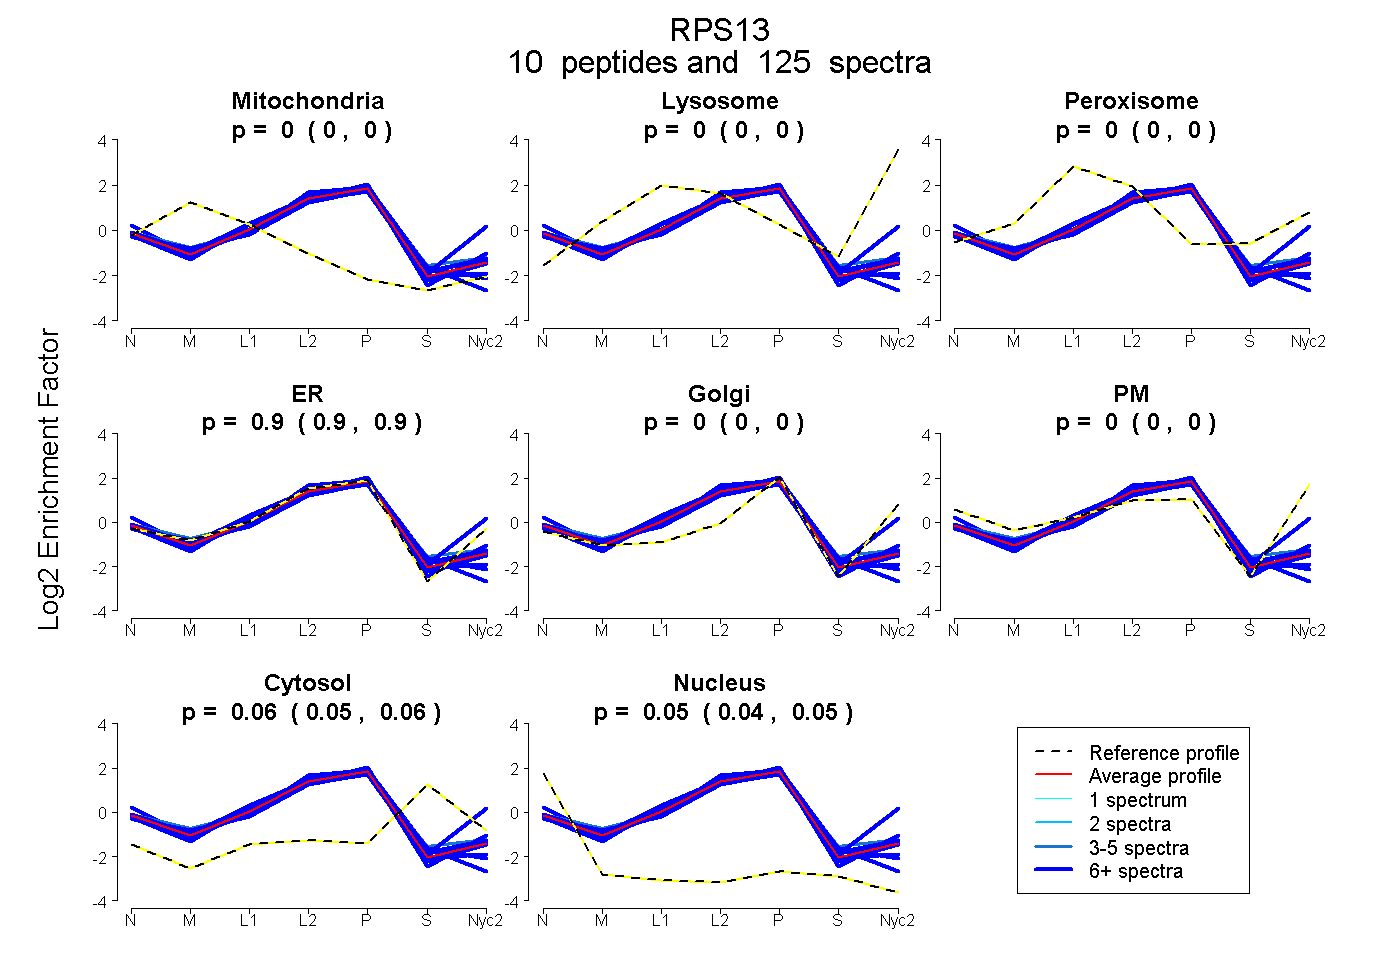
0.000 | 0.000
0.000 | 0.000
0.000 | 0.000
0.896 | 0.899
0.000 | 0.000
0.000 | 0.000
0.054 | 0.060
0.042 | 0.048
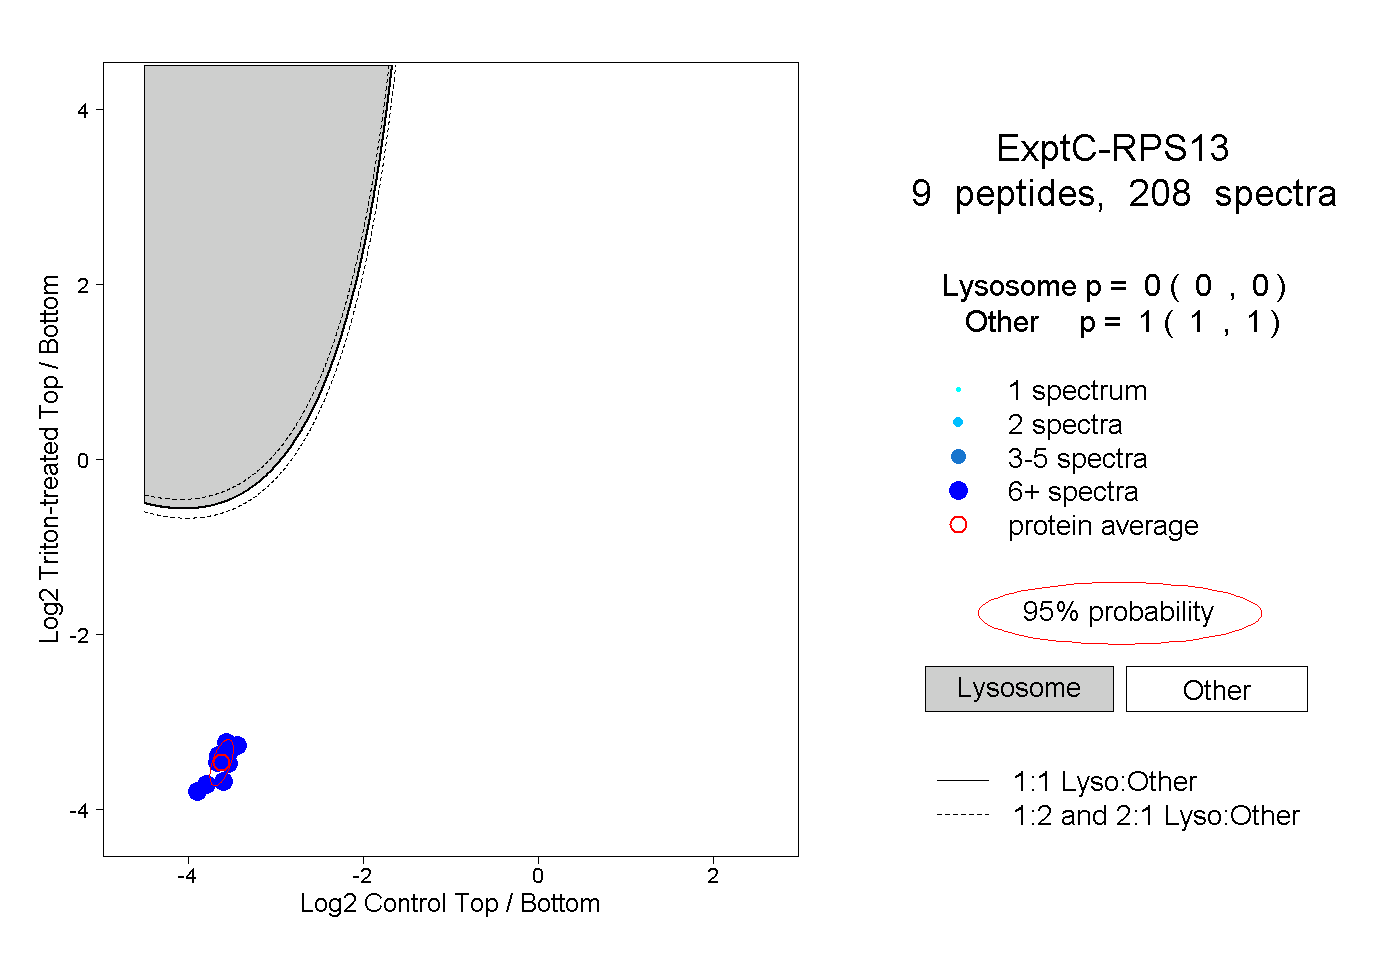
7peptides
spectra

0.000 | 0.000
0.197 | 0.227
0.728 | 0.753
0.000 | 0.000
0.000 | 0.000
0.035 | 0.053
0.000 | 0.000
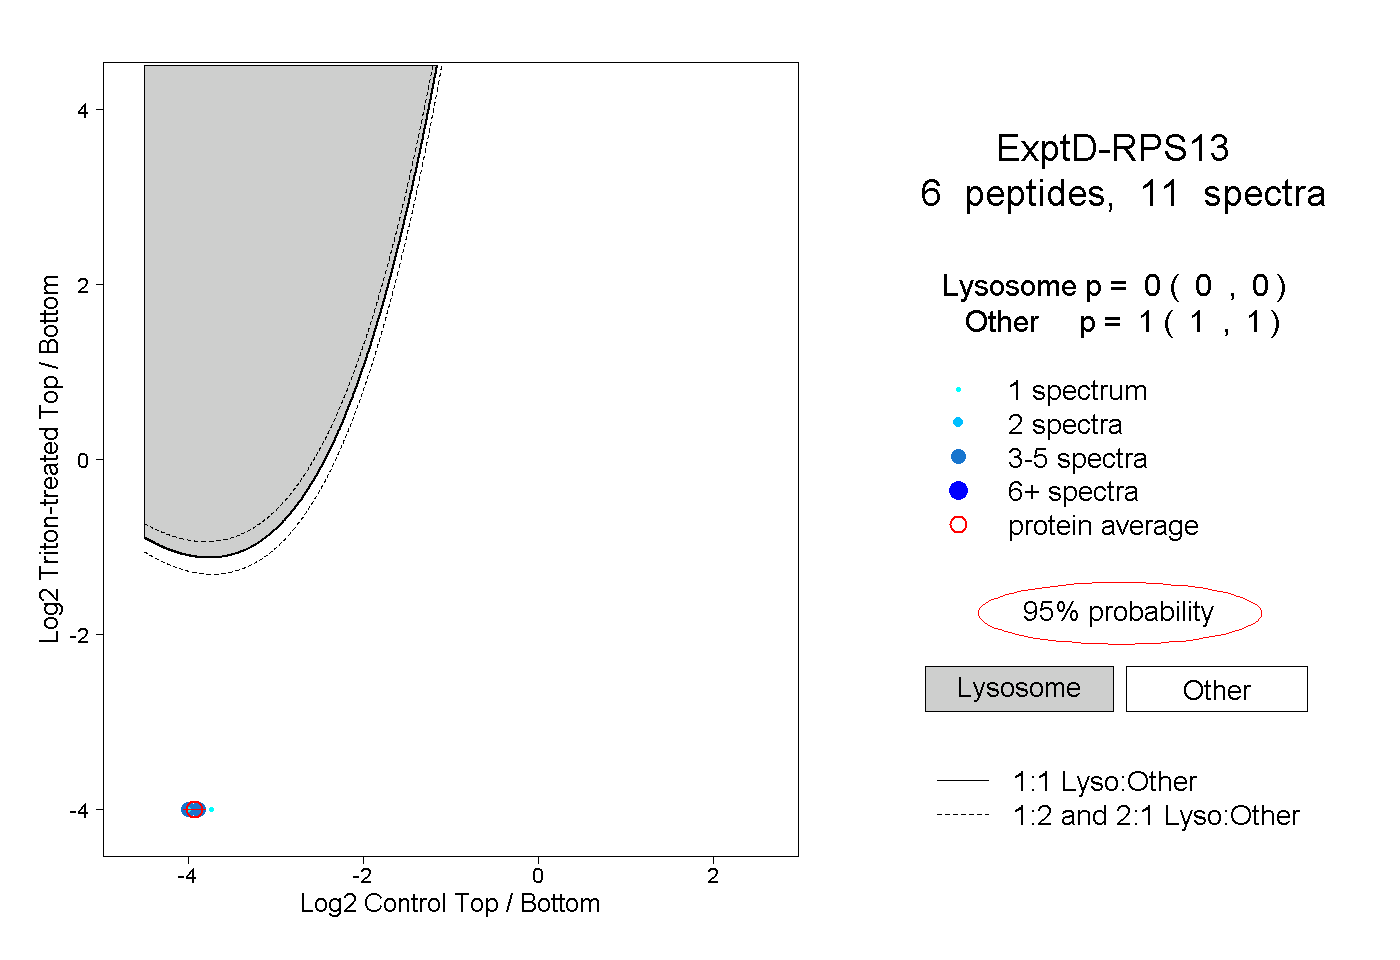
9peptides
spectra
0.000 | 0.000
1.000 | 1.000