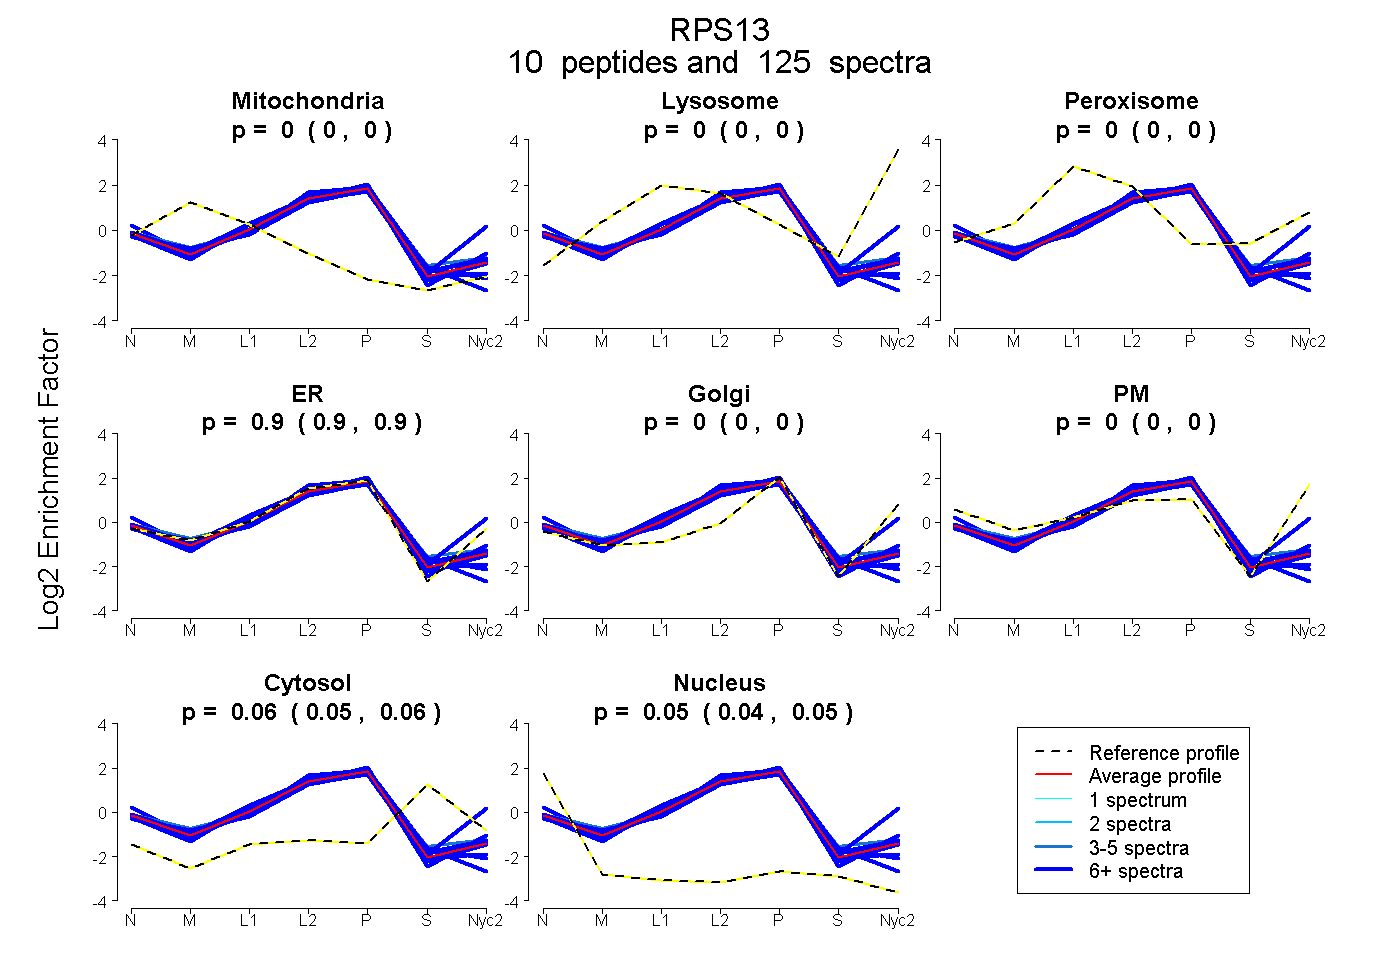
 10
10peptides
spectra
0.000 | 0.000
0.000 | 0.000
0.000 | 0.000
0.896 | 0.899
0.000 | 0.000
0.000 | 0.000
0.054 | 0.060
0.042 | 0.048
| Plot | Mito | Lyso | Perox | ER | Golgi | PM | Cytosol | Nucleus | |||||
| Expt A |
10 peptides |
125 spectra |
|
0.000 0.000 | 0.000 |
0.000 0.000 | 0.000 |
0.000 0.000 | 0.000 |
0.898 0.896 | 0.899 |
0.000 0.000 | 0.000 |
0.000 0.000 | 0.000 |
0.057 0.054 | 0.060 |
0.045 0.042 | 0.048 |
| 8 spectra, MHAPGK | 0.000 | 0.000 | 0.000 | 0.860 | 0.000 | 0.000 | 0.098 | 0.042 | ||
| 7 spectra, LTSDDVK | 0.024 | 0.000 | 0.000 | 0.814 | 0.000 | 0.000 | 0.099 | 0.063 | ||
| 12 spectra, VLPPNWK | 0.000 | 0.000 | 0.009 | 0.952 | 0.000 | 0.000 | 0.000 | 0.039 | ||
| 13 spectra, SVPTWLK | 0.000 | 0.071 | 0.000 | 0.757 | 0.100 | 0.005 | 0.066 | 0.000 | ||
| 7 spectra, GLAPDLPEDFYHLIK | 0.000 | 0.000 | 0.000 | 0.837 | 0.000 | 0.000 | 0.080 | 0.083 | ||
| 5 spectra, ITDSDVK | 0.021 | 0.000 | 0.000 | 0.843 | 0.000 | 0.000 | 0.136 | 0.000 | ||
| 6 spectra, FVTGNK | 0.000 | 0.000 | 0.000 | 0.904 | 0.000 | 0.000 | 0.090 | 0.006 | ||
| 25 spectra, GLSQSALPYR | 0.000 | 0.000 | 0.000 | 0.927 | 0.000 | 0.000 | 0.020 | 0.053 | ||
| 27 spectra, DSHGVAQVR | 0.000 | 0.000 | 0.004 | 0.886 | 0.000 | 0.000 | 0.004 | 0.107 | ||
| 15 spectra, GLTPSQIGVILR | 0.000 | 0.000 | 0.000 | 0.914 | 0.000 | 0.000 | 0.045 | 0.041 |
| Plot | Mito | Lyso or Perox | ER | Golgi | PM | Cytosol | Nucleus | ||||||
| Expt B |
7 peptides |
24 spectra |
 |
0.000 0.000 | 0.000 |
0.214 0.197 | 0.227 |
0.742 0.728 | 0.753 |
0.000 0.000 | 0.000 |
0.000 0.000 | 0.000 |
0.044 0.035 | 0.053 |
0.000 0.000 | 0.000 |
|||
| Plot | Lyso | Other | |||||||||||
| Expt C |
9 peptides |
208 spectra |
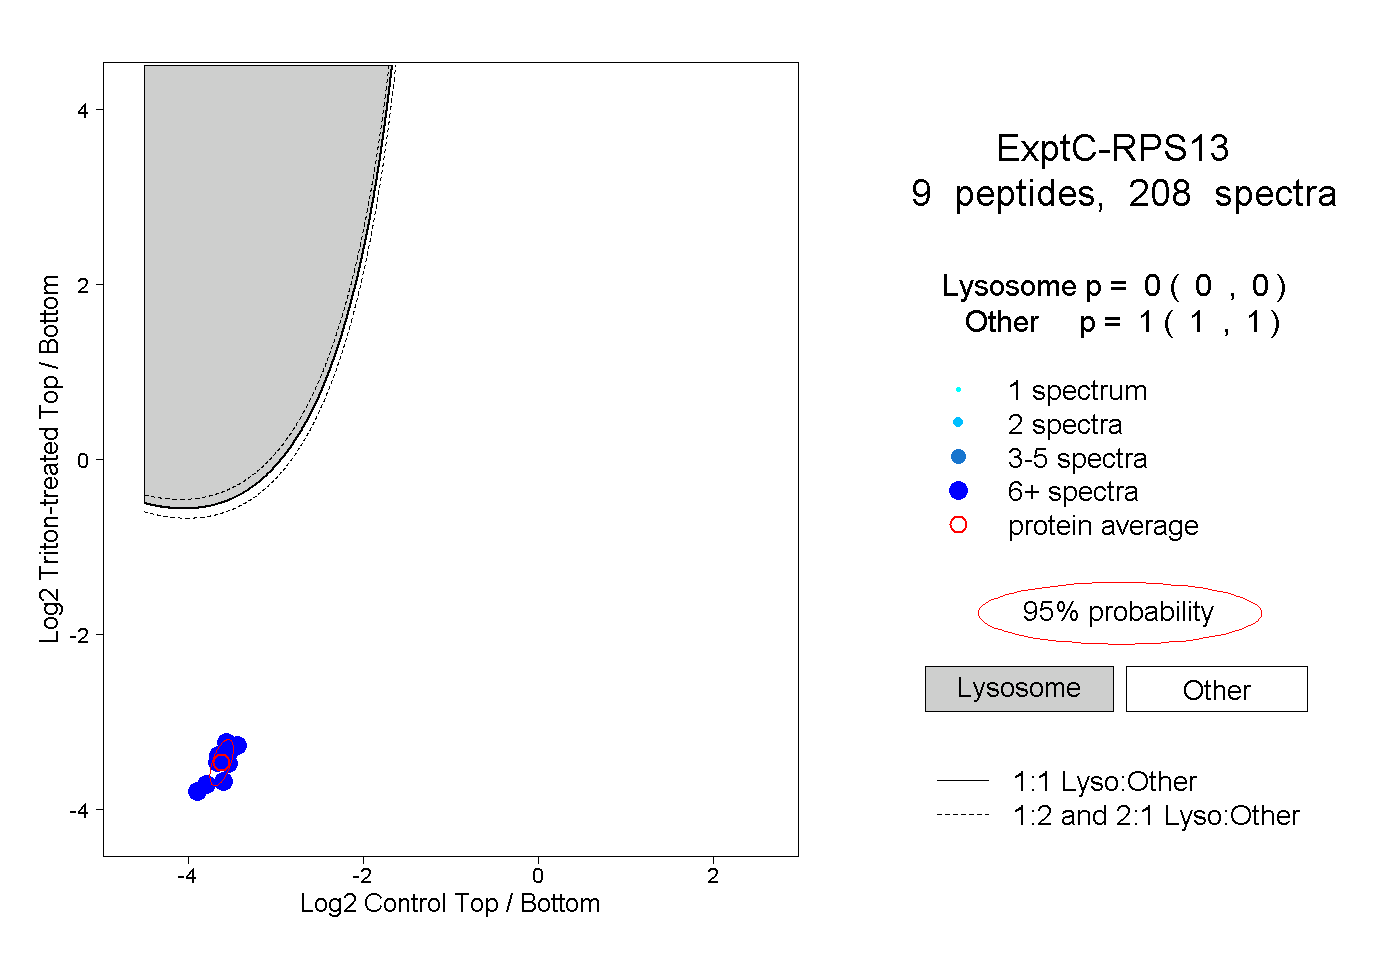 |
0.000 0.000 | 0.000 |
1.000 1.000 | 1.000 |
||||||||
| Plot | Lyso | Other | |||||||||||
| Expt D |
6 peptides |
11 spectra |
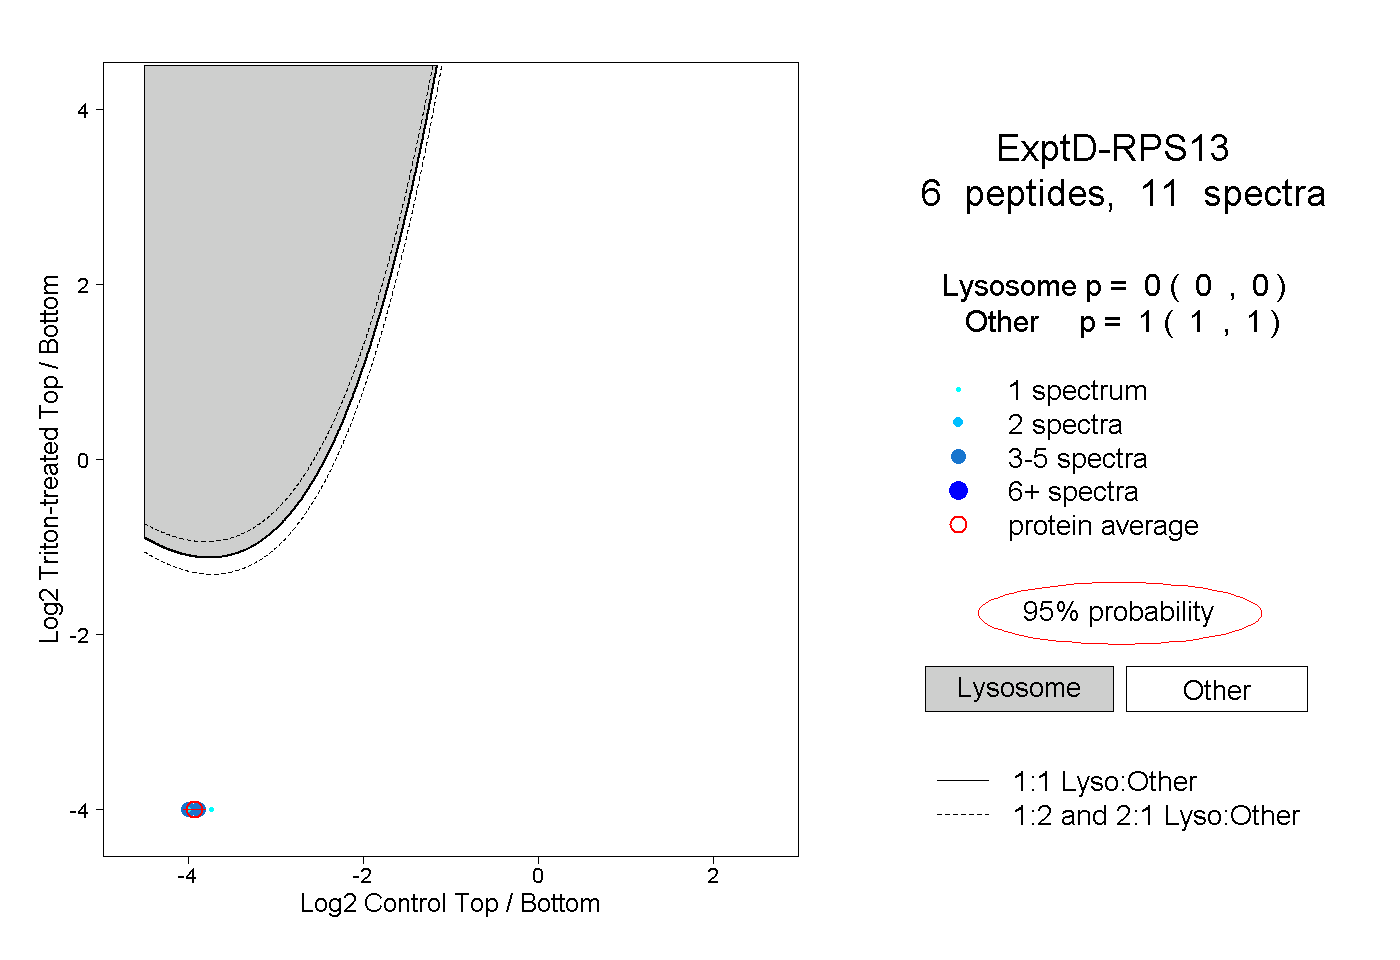 |
0.000 0.000 | 0.000 |
1.000 1.000 | 1.000 |