 5
5peptides
spectra
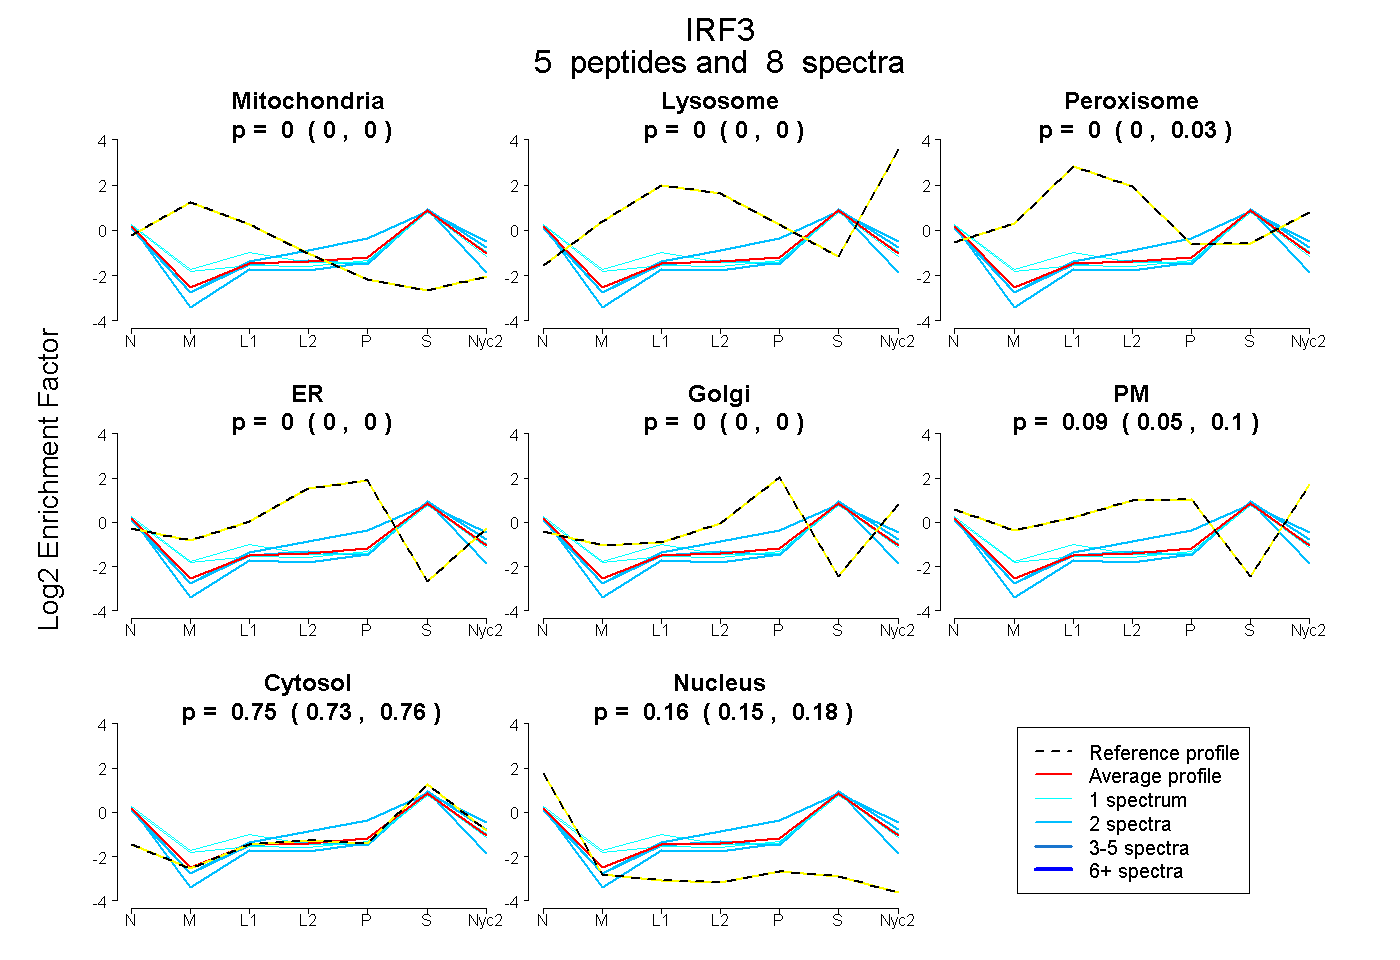
0.000 | 0.000
0.000 | 0.000
0.000 | 0.027
0.000 | 0.000
0.000 | 0.000
0.052 | 0.103
0.731 | 0.760
0.147 | 0.178
| Plot | Mito | Lyso | Perox | ER | Golgi | PM | Cytosol | Nucleus | |||||
| Expt A |
5 peptides |
8 spectra |
|
0.000 0.000 | 0.000 |
0.000 0.000 | 0.000 |
0.000 0.000 | 0.027 |
0.000 0.000 | 0.000 |
0.000 0.000 | 0.000 |
0.087 0.052 | 0.103 |
0.751 0.731 | 0.760 |
0.162 0.147 | 0.178 |
| 2 spectra, AGQCLWAQR | 0.000 | 0.000 | 0.000 | 0.000 | 0.000 | 0.000 | 0.739 | 0.261 | ||
| 2 spectra, VYEFVTPGGAR | 0.000 | 0.000 | 0.000 | 0.000 | 0.052 | 0.151 | 0.738 | 0.058 | ||
| 1 spectrum, VVPTCLK | 0.000 | 0.000 | 0.054 | 0.000 | 0.000 | 0.052 | 0.695 | 0.198 | ||
| 1 spectrum, GVAWLDESR | 0.000 | 0.000 | 0.173 | 0.000 | 0.000 | 0.002 | 0.628 | 0.197 | ||
| 2 spectra, ELLEMAR | 0.000 | 0.000 | 0.000 | 0.000 | 0.000 | 0.071 | 0.780 | 0.149 |
| Plot | Lyso | Other | |||||||||||
| Expt C |
4 peptides |
8 spectra |
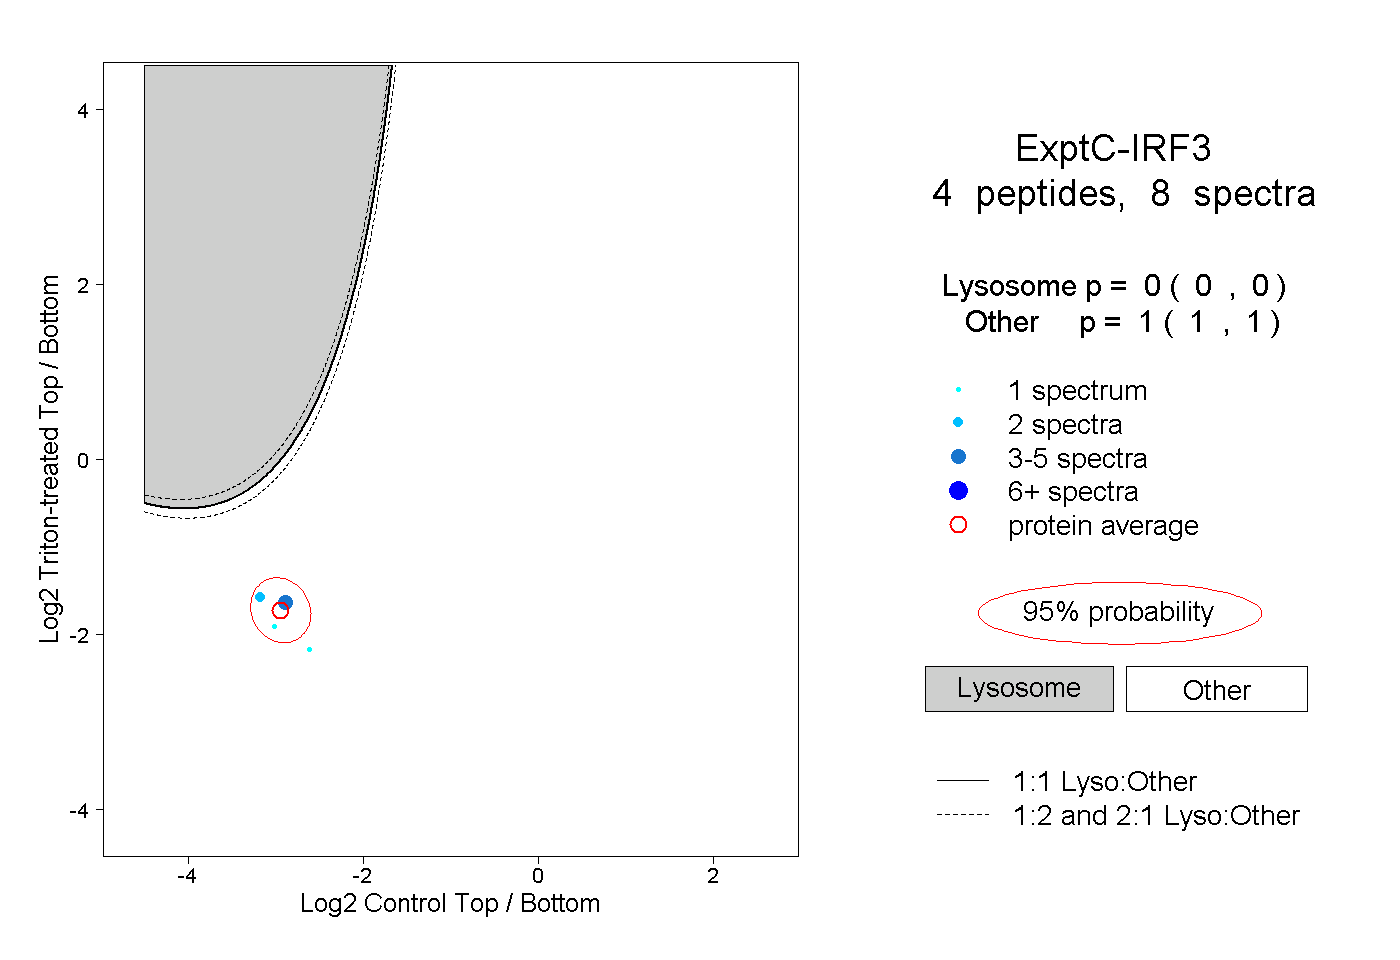 |
0.000 0.000 | 0.000 |
1.000 1.000 | 1.000 |