SLC25A24
[ENSRNOP00000027765]
Main page
| | | Plot |
Mito |
Lyso |
|
Perox |
ER |
Golgi |
PM |
Cytosol |
Nucleus |
|
| Expt A |
 11
11
peptides |
24
spectra |
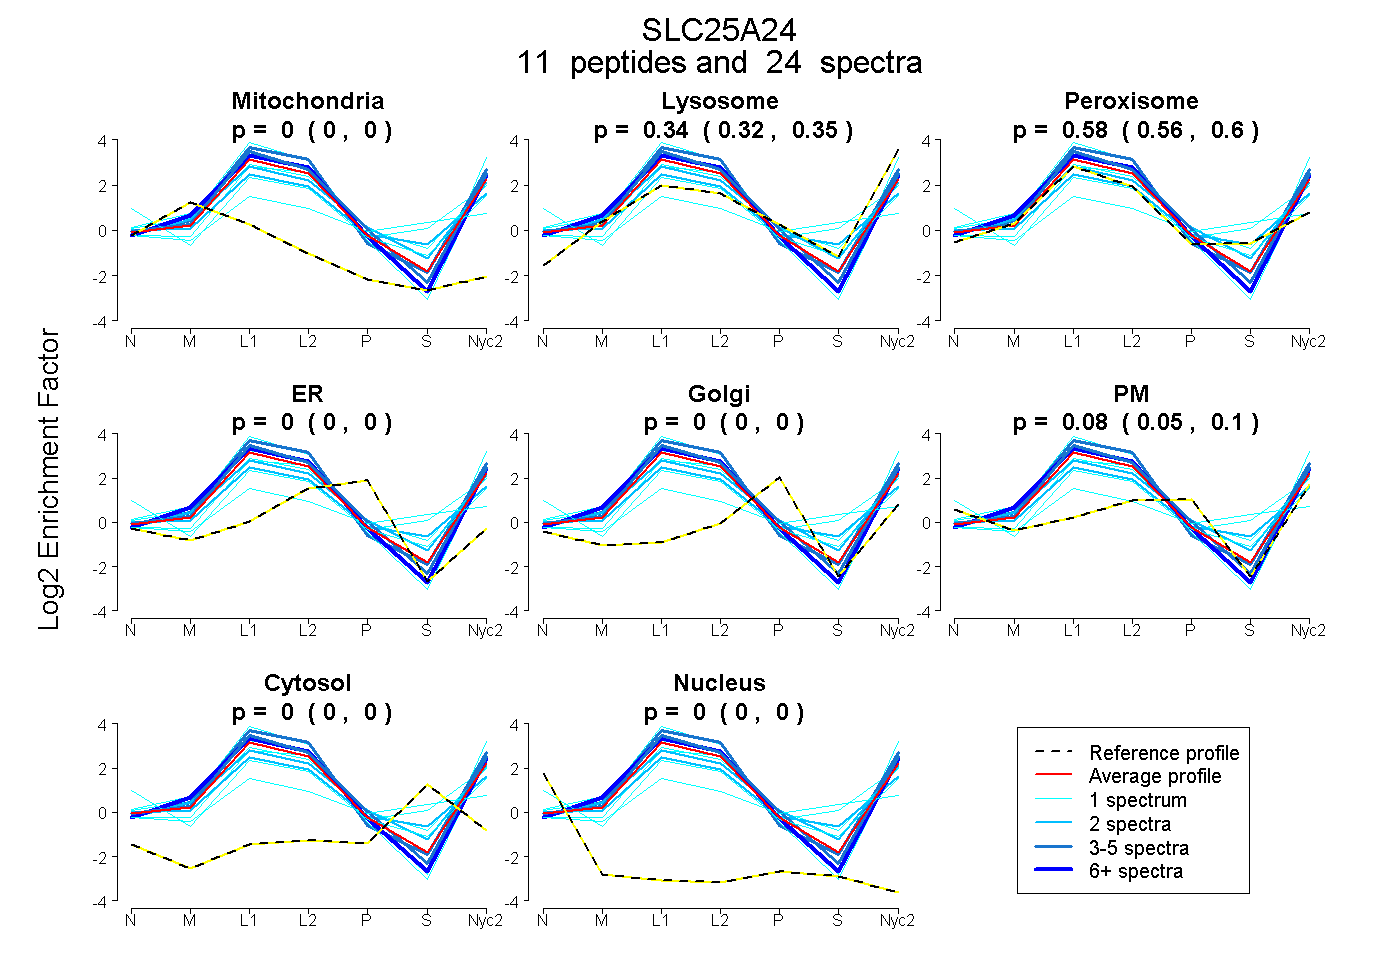 |
0.000
0.000 | 0.000 |
0.339
0.319 | 0.355 |
|
0.585
0.562 | 0.603 |
0.000
0.000 | 0.000 |
0.000
0.000 | 0.000 |
0.076
0.054 | 0.095 |
0.000
0.000 | 0.000 |
0.000
0.000 | 0.000 |
|
| | | Plot |
Mito |
|
Lyso or Perox |
|
ER |
Golgi |
PM |
Cytosol |
Nucleus |
|
| Expt B |
6
peptides |
7
spectra |
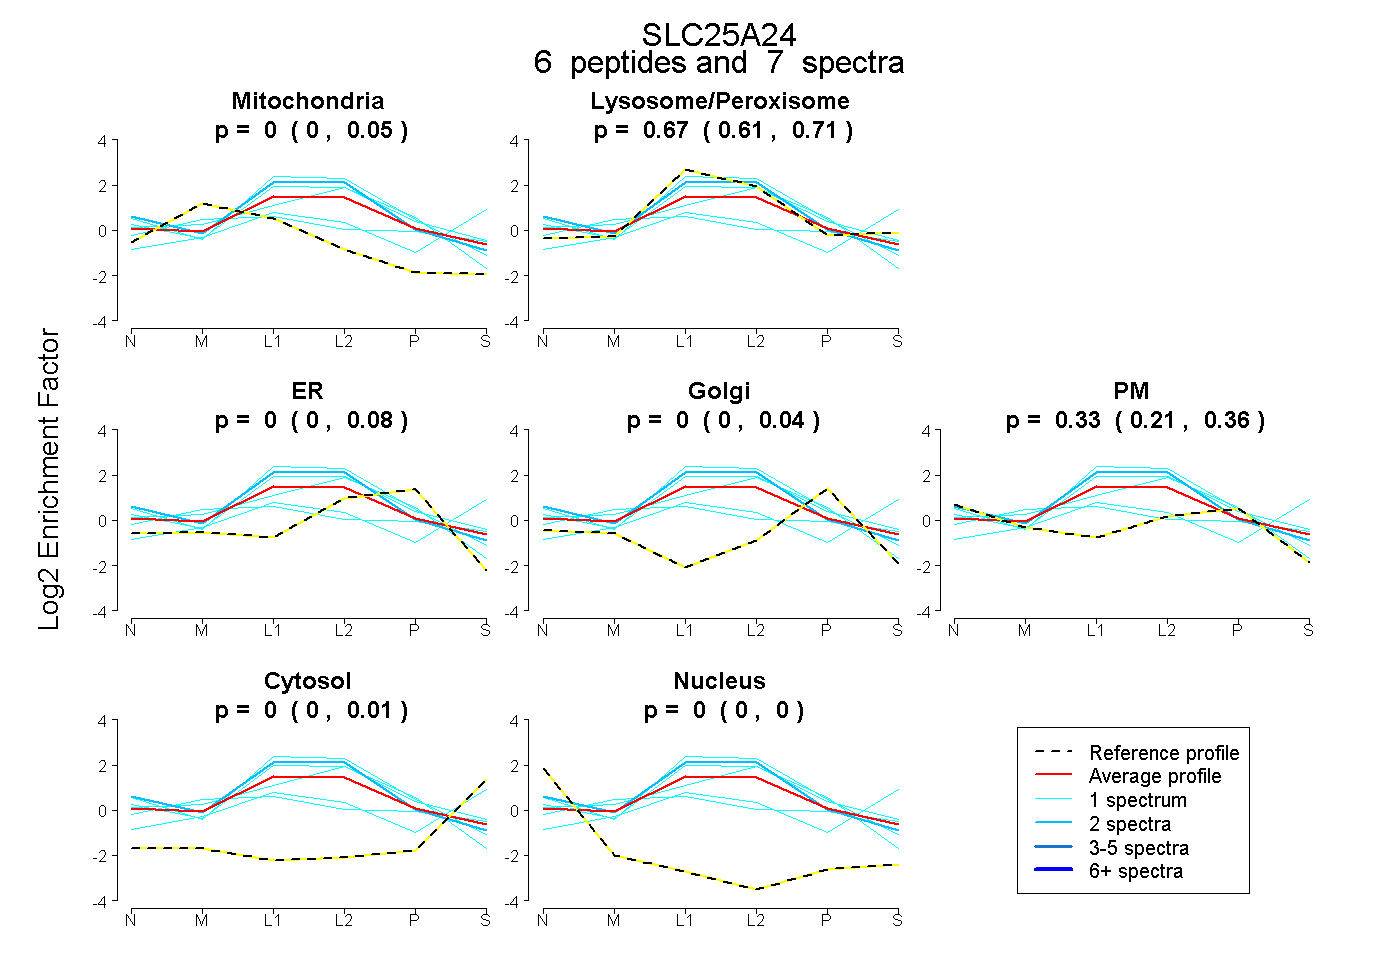 |
0.001
0.000 | 0.051 |
|
0.668
0.606 | 0.713 |
|
0.000
0.000 | 0.076 |
0.000
0.000 | 0.041 |
0.331
0.206 | 0.359 |
0.000
0.000 | 0.013 |
0.000
0.000 | 0.000 |
|
| | | Plot |
|
Lyso |
|
|
|
|
|
|
|
Other |
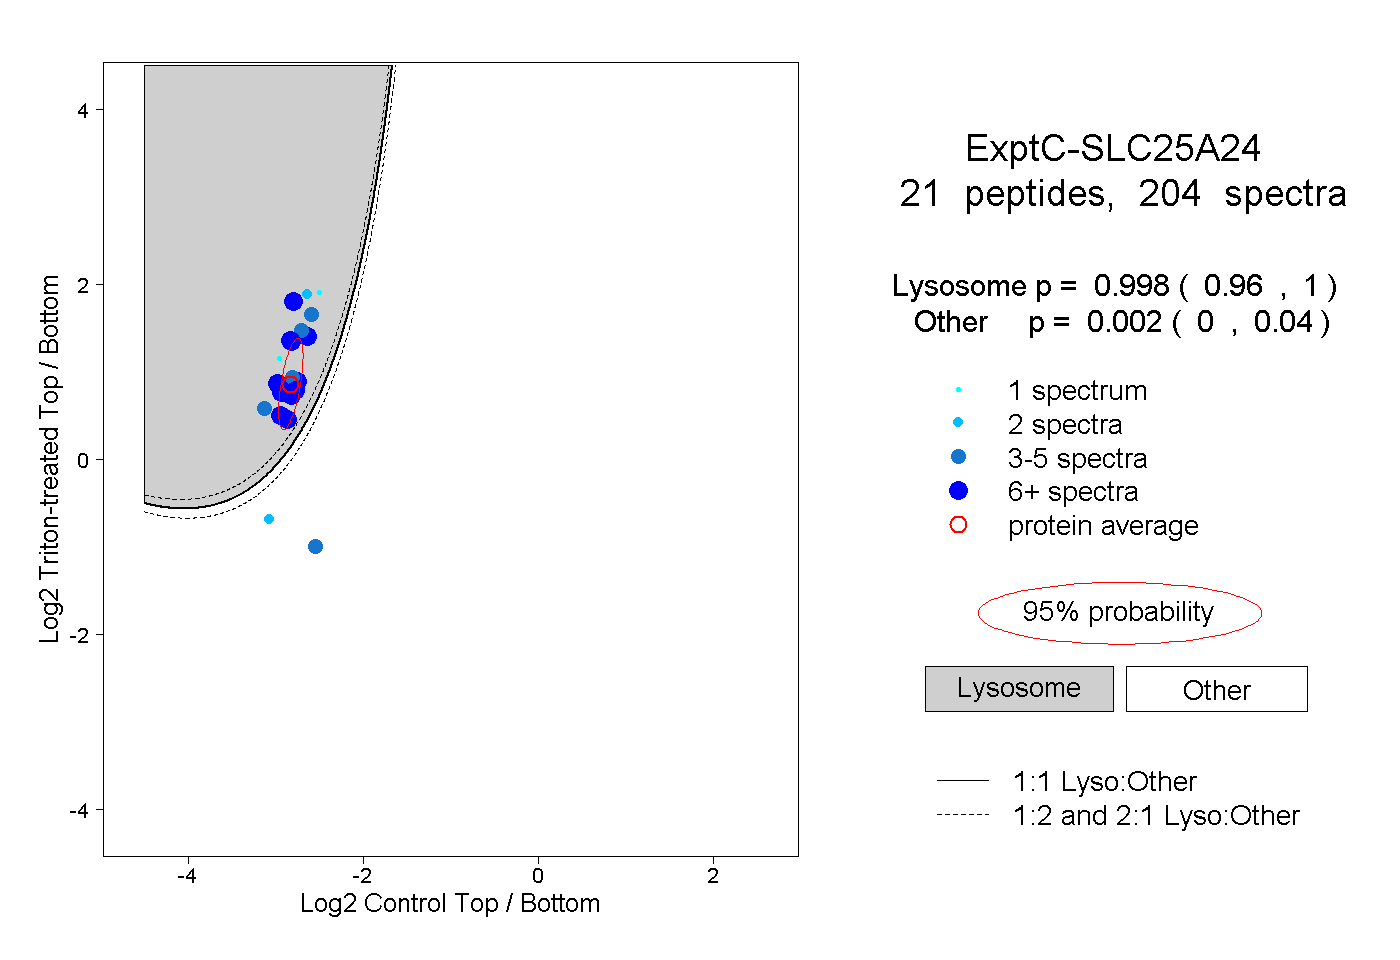
| Expt C |
21
peptides |
204
spectra |
 |
|
0.998
0.960 | 1.000 |
|
|
|
|
|
|
|
0.002
0.000 | 0.040 |
| | | Plot |
|
Lyso |
|
|
|
|
|
|
|
Other |
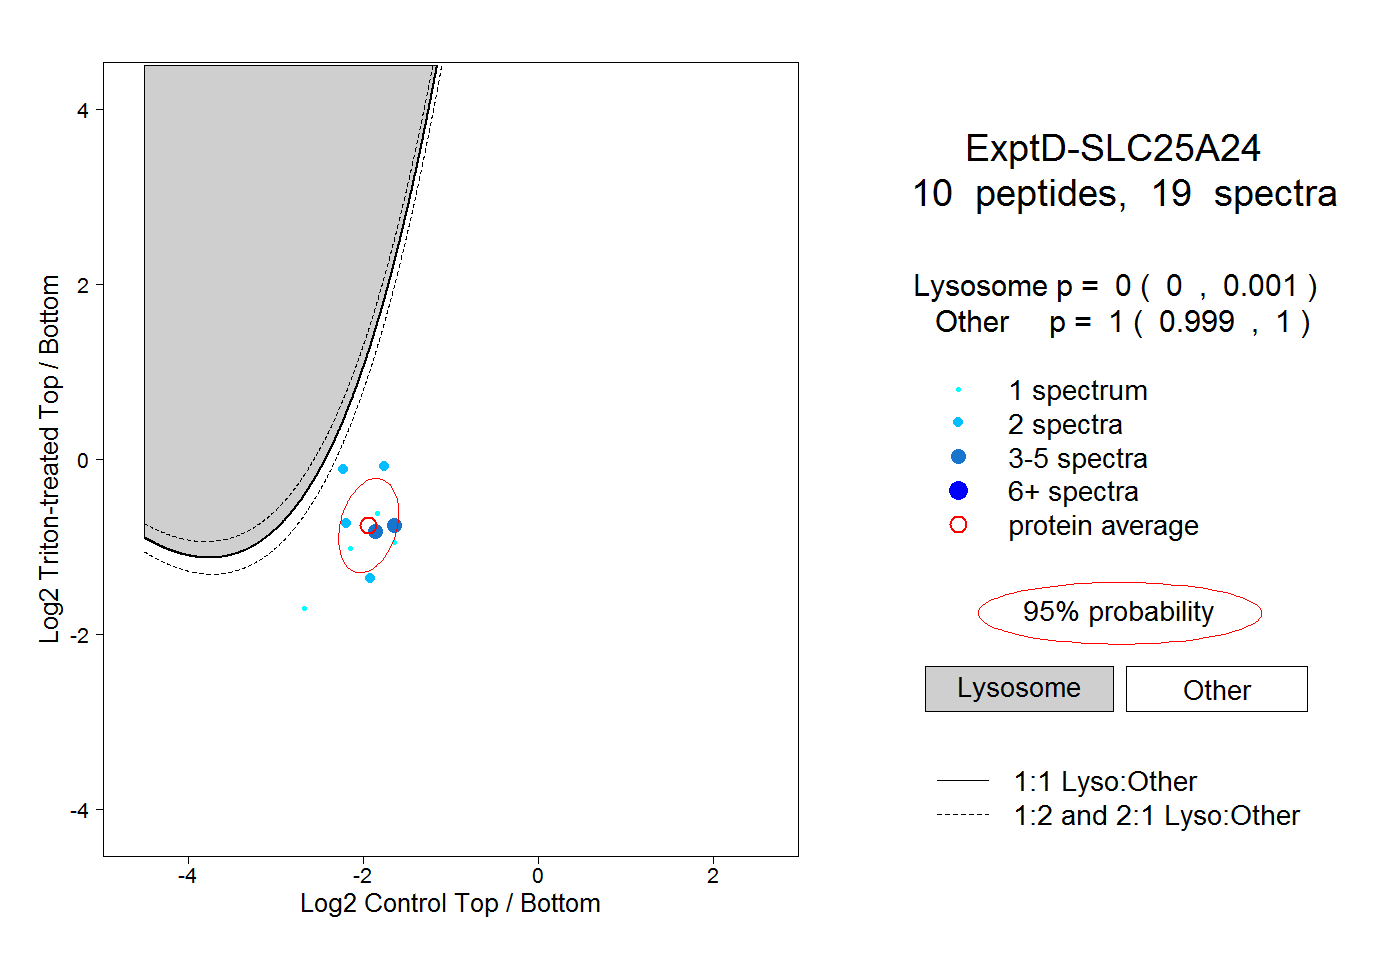
| Expt D |
10
peptides |
19
spectra |
 |
|
0.000
0.000 | 0.001 |
|
|
|
|
|
|
|
1.000
0.999 | 1.000 |
| 1 spectrum, SMNIFGGFR |
|
0.000 |
|
|
|
|
|
|
|
1.000 |
| 1 spectrum, LLTEEGQK |
|
0.000 |
|
|
|
|
|
|
|
1.000 |
| 4 spectra, IAPETAVK |
|
0.000 |
|
|
|
|
|
|
|
1.000 |
| 2 spectra, GITPNFMK |
|
0.000 |
|
|
|
|
|
|
|
1.000 |
| 1 spectrum, GNGINVLK |
|
0.000 |
|
|
|
|
|
|
|
1.000 |
| 1 spectrum, QTLGVAQK |
|
0.000 |
|
|
|
|
|
|
|
1.000 |
| 2 spectra, EGVSGLYR |
|
0.041 |
|
|
|
|
|
|
|
0.959 |
| 2 spectra, IFTTGDVNK |
|
0.000 |
|
|
|
|
|
|
|
1.000 |
| 2 spectra, TSTAPLDR |
|
0.001 |
|
|
|
|
|
|
|
0.999 |
| 3 spectra, QLLAGGVAGAVSR |
|
0.000 |
|
|
|
|
|
|
|
1.000 |